1.3 Why is R so great?
As you’ve already gotten this book, you probably already have some idea why R is so great. However, in order to help prevent you from giving up the first time you run into a programming wall, let me give you a few more reasons:
R is 100% free and as a result, has a huge support community. Unlike SPSS, Matlab, Excel and JMP, R is, and always will be completely free. This doesn’t just help your wallet - it means that a huge community of R programmers will constantly develop an distribute new R functionality and packages at a speed that leaves all those other packages in the dust! Unlike Fight Club, the first rule of R is “Do talk about R!” The size of the R programming community is staggering. If you ever have a question about how to implement something in R, a quick Poogle search will lead you to your answer virtually every single time.
R is the present, and future of statistical programming. To illustrate this, look at the following three figures. These are Google trend searches for three terms: R Programming, Matlab, and SPSS. Try and guess which one is which.

R is incredibly versatile. You can use R to do everything from calculating simple summary statistics, to performing complex simulations to creating gorgeous plots like the chord diagram on the right. If you can imagine an analytical task, you can almost certainly implement it in R.
Using RStudio, a program to help you write R code, You can easily and seamlessly combine R code, analyses, plots, and written text into elegant documents all in one place using Sweave (R and Latex) or RMarkdown. In fact, I translated this entire book (the text, formatting, plots, code…yes, everything) in RStudio using Sweave. With RStudio and Sweave, instead of trying to manage two or three programs, say Excel, Word and (sigh) SPSS, where you find yourself spending half your time copying, pasting and formatting data, images and test, you can do everything in one place so nothing gets misread, mistyped, or forgotten.
circlize::chordDiagram(matrix(sample(10),
                              nrow = 2, ncol = 5))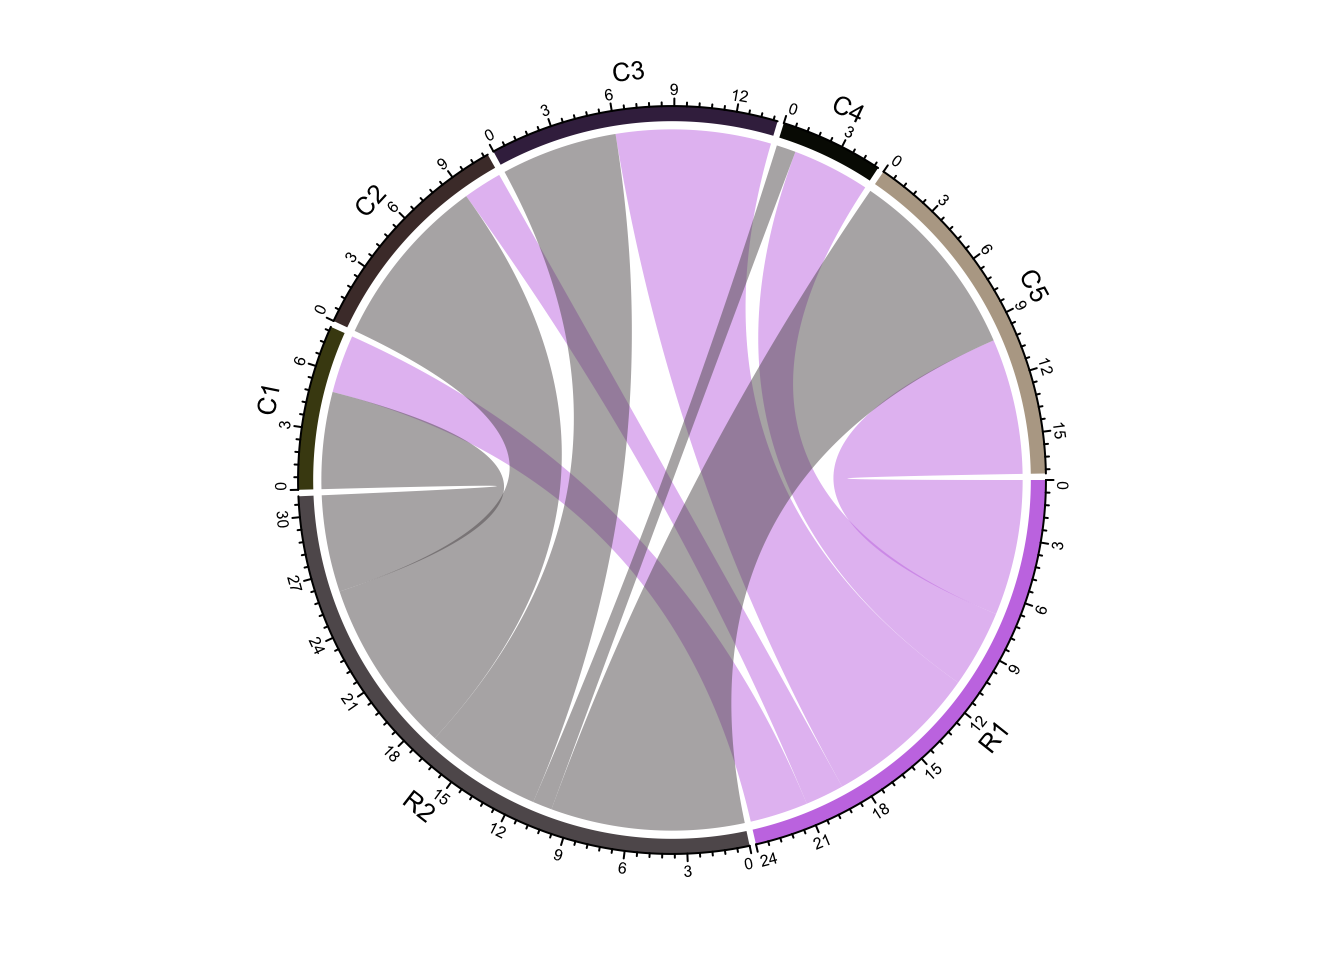
Figure 1.1: A super cool chord diagram from the circlize package
Analyses conducted in R are transparent, easily shareable, and reproducible. If you ask an SPSS user how they conducted a specific analyses, they will either A) Not remember, B) Try (nervously) to construct an analysis procedure on the spot that makes sense - which may or may not correspond to what they actually did months or years ago, or C) Ask you what you are doing in their house. I used to primarily use SPSS, so I speak from experience on this. If you ask an R user (who uses good programming techniques!) how they conducted an analysis, they should always be able to show you the exact code they used. Of course, this doesn’t mean that they used the appropriate analysis or interpreted it correctly, but with all the original code, any problems should be completely transparent!
And most importantly of all, R is the programming language of choice for pirates.