Test your R might! Purdy pictures

- The
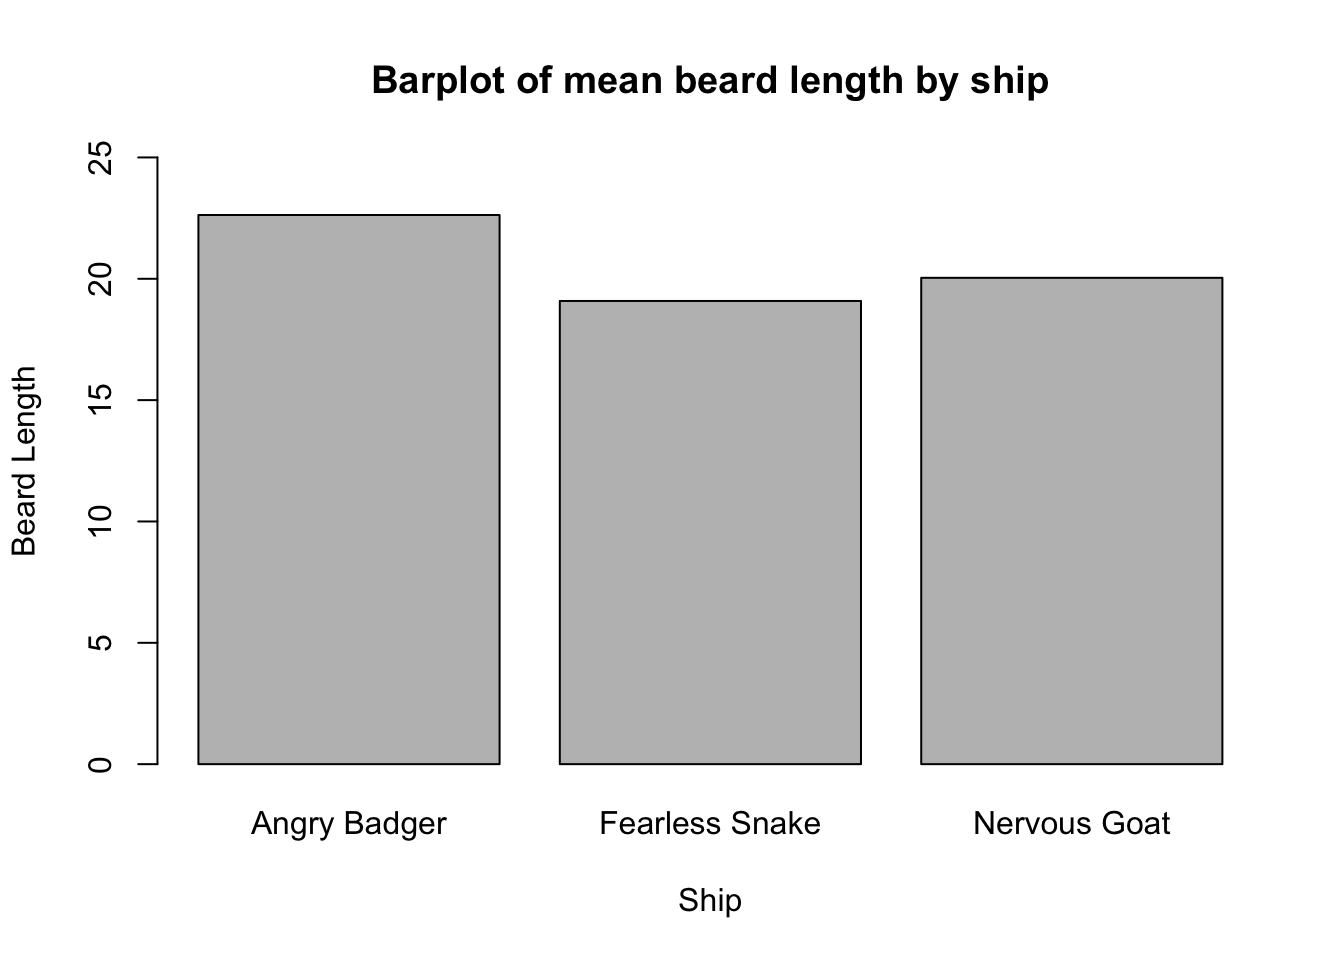
BeardLengths dataframe (contained in the yarrr package or online at https://github.com/ndphillips/ThePiratesGuideToR/raw/master/data/BeardLengths.txt) contains data on the lengths of beards from 3 different pirate ships. Calculate the average beard length for each ship using aggregate(), then create the following barplot:
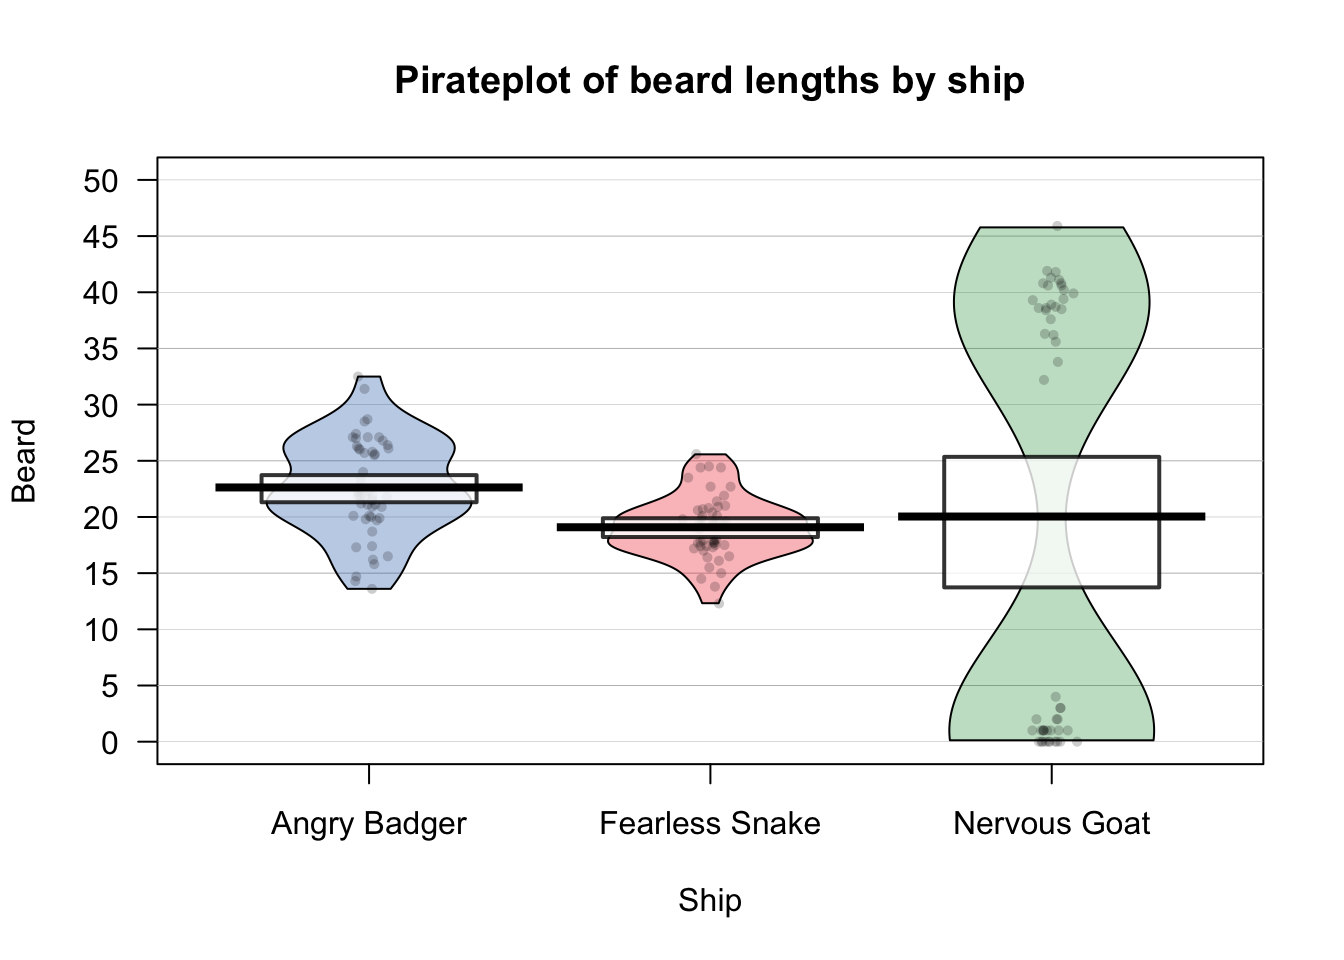
- Now using the entire
BeardLengths dataframe, create the following pirateplot:
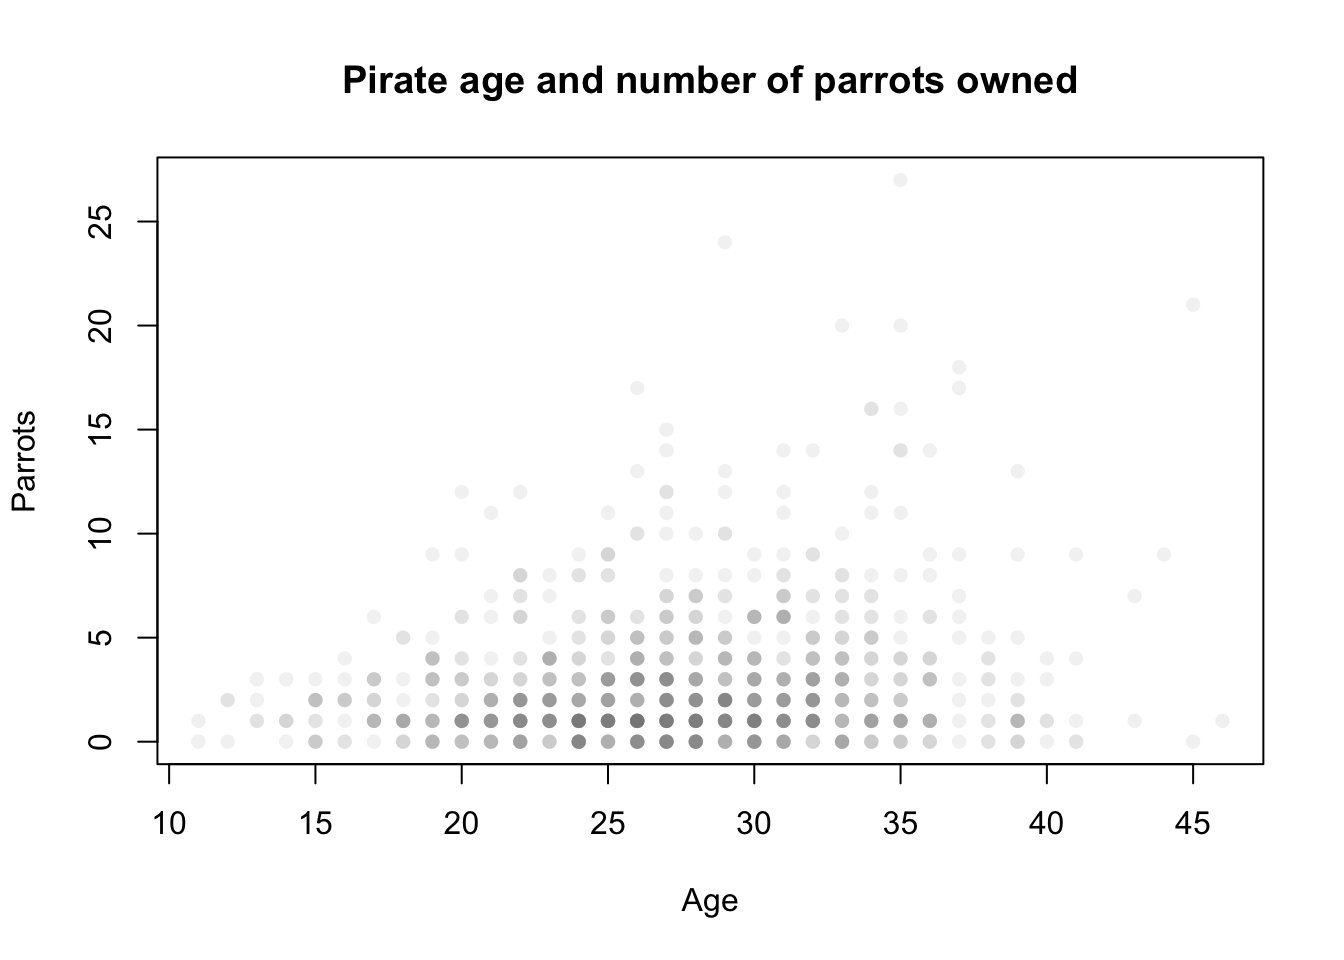
- Using the
pirates dataset, create the following scatterplot showing the relationship between a pirate’s age and how many parrot’s (s)he has owned (hint: to make the points solid and transparent, use pch = 16, and col = gray(level = .5, alpha = .1)).