11.3 Scatterplot: plot()
The most common high-level plotting function is plot(x, y). The plot() function makes a scatterplot from two vectors x and y, where the x vector indicates the x (horizontal) values of the points, and the y vector indicates the y (vertical) values.
| Argument | Description |
|---|---|
x, y |
Vectors of equal length specifying the x and y values of the points |
type |
Type of plot. "l" means lines, "p" means points, "b" means lines and points, "n" means no plotting |
main, xlab, ylab |
Strings giving labels for the plot title, and x and y axes |
xlim, ylim |
Limits to the axes. For example, xlim = c(0, 100) will set the minimum and maximum of the x-axis to 0 and 100. |
pch |
An integer indicating the type of plotting symbols (see ?points and section below), or a string specifying symbols as text. For example, pch = 21 will create a two-color circle, while pch = "P" will plot the character "P". To see all the different symbol types, run ?points. |
col |
Main color of the plotting symbols. For example col = "red" will create red symbols. |
cex |
A numeric vector specifying the size of the symbols (from 0 to Inf). The default size is 1. cex = 4 will make the points very large, while cex = .5 will make them very small. |
plot(x = 1:10,                         # x-coordinates
     y = 1:10,                         # y-coordinates
     type = "p",                       # Just draw points (no lines)
     main = "My First Plot",
     xlab = "This is the x-axis label",
     ylab = "This is the y-axis label",
     xlim = c(0, 11),                  # Min and max values for x-axis
     ylim = c(0, 11),                  # Min and max values for y-axis
     col = "blue",                     # Color of the points
     pch = 16,                         # Type of symbol (16 means Filled circle)
     cex = 1)                           # Size of the symbols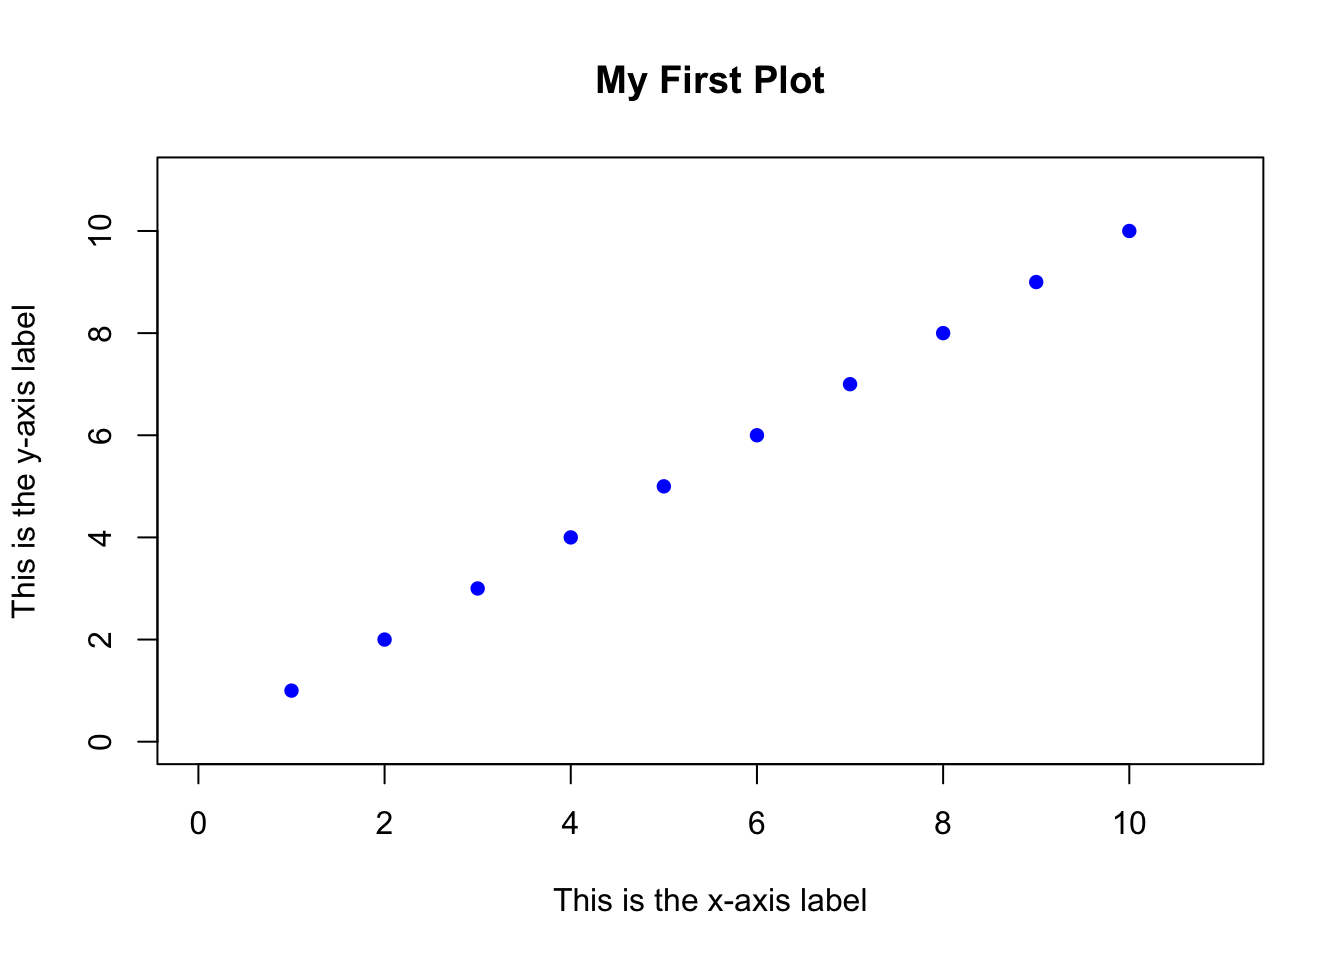
Aside from the x and y arguments, all of the arguments are optional. If you don’t specify a specific argument, then R will use a default value, or try to come up with a value that makes sense. For example, if you don’t specify the xlim and ylim arguments, R will set the limits so that all the points fit inside the plot.
11.3.1 Symbol types: pch
When you create a plot with plot() (or points with points()), you can specify the type of symbol with the pch argument. You can specify the symbol type in one of two ways: with an integer, or with a string. If you use a string (like "p"), R will use that text as the plotting symbol. If you use an integer value, you’ll get the symbol that correspond to that number. See Figure for all the symbol types you can specify with an integer.
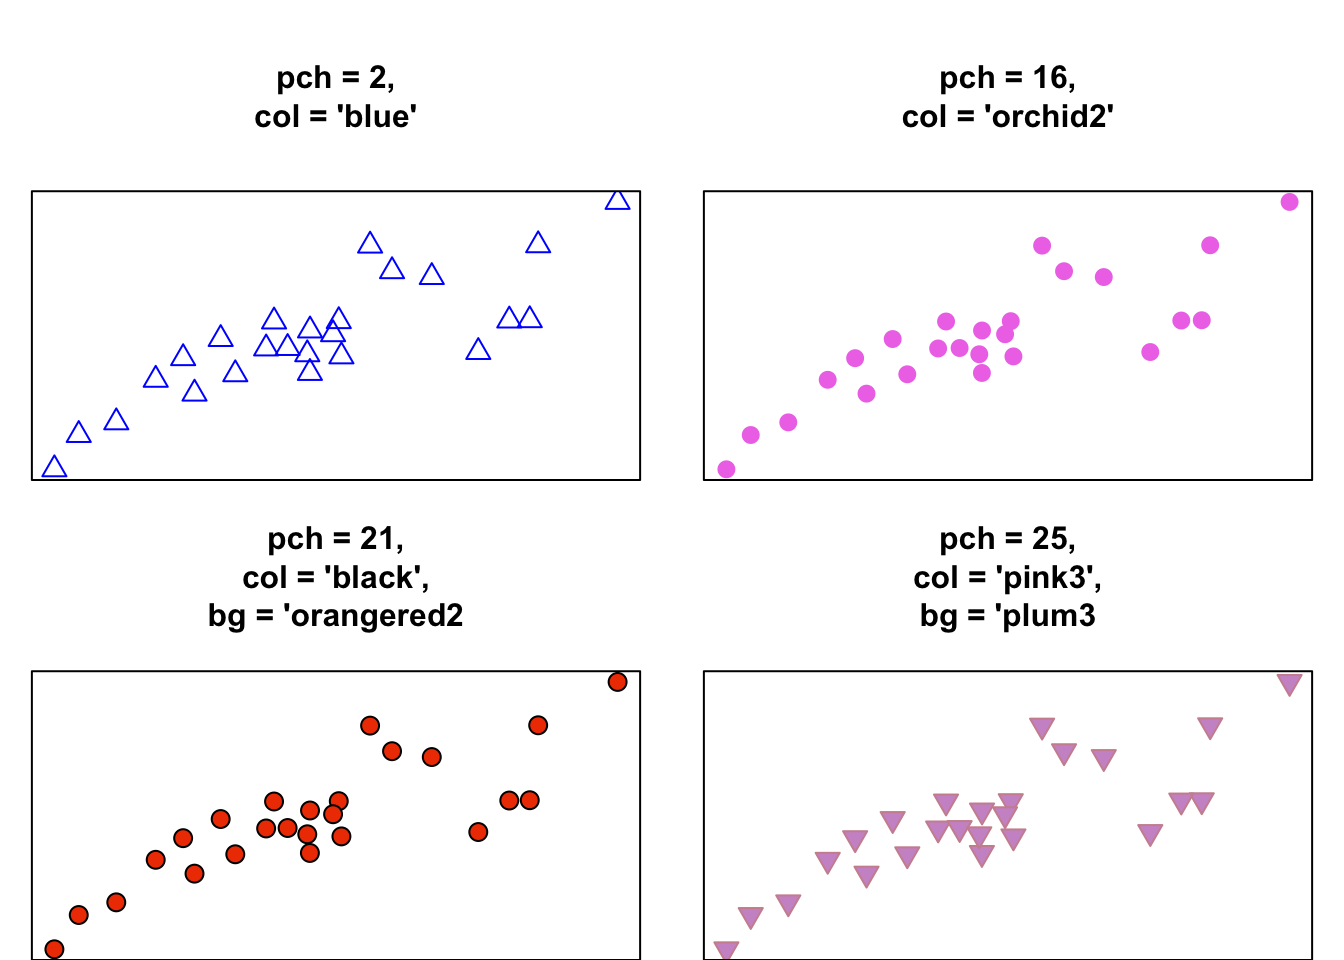
Symbols differ in their shape and how they are colored. Symbols 1 through 14 only have borders and are always empty, while symbols 15 through 20 don’t have a border and are always filled. Symbols 21 through 25 have both a border and a filling. To specify the border color or background for symbols 1 through 20, use the col argument. For symbols 21 through 25, you set the color of the border with col, and the color of the background using bg
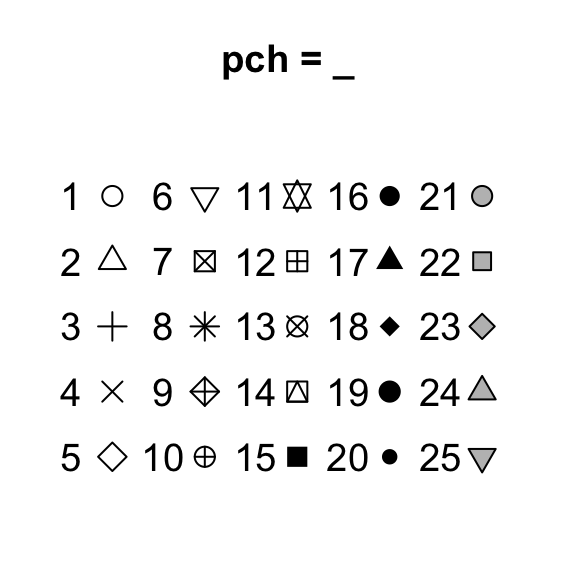
Figure 11.4: The symbol types associated with the pch plotting parameter.
Let’s look at some different symbol types in action when applied to the same data: