Thoughts on Teaching Week 5 tutorial
Return to index of tutor information.
Thoughts on Sect. 5.1
With \(22\) observations, the median is halfway between the \(11\)th and \(12\)th ordered observations (observation number \((22 + 1)/2 = 11.5\)): both be in the second bar, so the median is somewhere between \(8\) and \(10\) mm (we cannot be sure based on the histogram, as information is lost). If they understand the histogram, they should also see that the smallest breadth is about \(6\) mm, so a median of \(4\) mm makes no sense.
If you have the time: Ask how to explain why they are wrong, and ask approximately what the median would be.Thoughts on Sect. 5.3
Thoughts on Sect. 5.5
This activity follows on from the ruler-drop planning activity from Week 2 (Sect. 2.5) and the data collection (Sect. 3.5. Use jamovi and the data file to create the numerical summary.
You can save this info to add to later if you wish.
In this activity, have students actually collect the data (quickly), according to the plan prepared in Sect. 2.5, at least as best as you can.
The data themselves aren't actually that important: it is more about using the data to show how to
- enter the data into software;
- draw graphs; and
- compute numerical summaries.
They are not meant to become experts in the software, but it useful for them to see.
I suggest having students enter their data into jamovi (Fig. E.1), and then you show them how to do some basic stuff.
If you have collect data from each person left and right hand (to study the average difference between left and right hand reaction, for instance), remember that the unit of analysis is the person, and each person gets two units of observation: jamovi and SPSS like data arranged with one unit of analysis (i.e. person in this case) per row (Fig. E.1).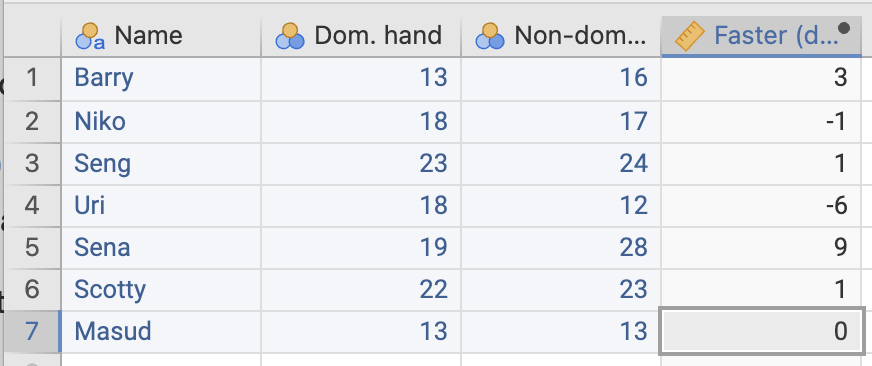
FIGURE E.1: Data entered in jamovi for the ruler-drop study