8.4 Item-level Relative Fit measures (Cont’d)
Before we try to identify the appropriate model for the following data. In this case, class represents the latent class/ groups, and prob represents the probability of being correct.
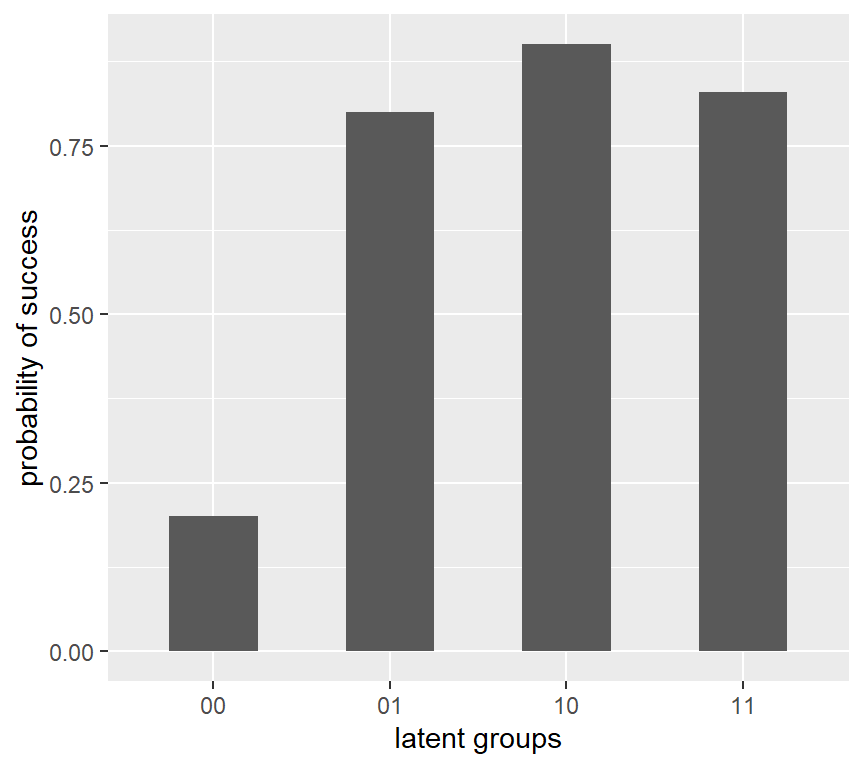
##   class prob
## 1    00 0.20
## 2    10 0.90
## 3    01 0.80
## 4    11 0.83
Let us explore the probability distribution of different attribute class. Can you guess the most appropriate model for the data?
Code