2.5 An example: A proportional reasoning test
This test was developed by de la Torre and his colleagues (Tjoe & Torre, 2014). Below are three example items:
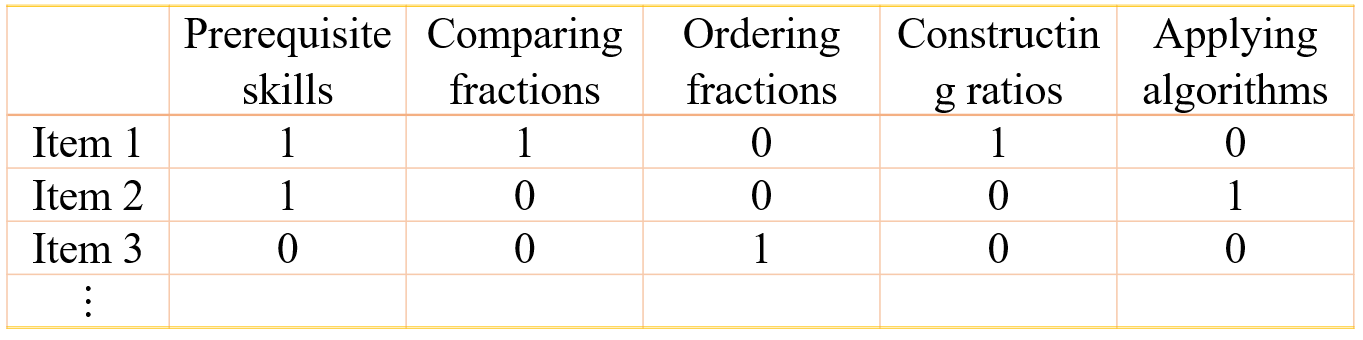
Nate and Dale are making s’mores. Nate has 4 marshmallows and 3 crackers. Dale has 7 marshmallows and twice as many crackers as Nate. Whose s’mores have a stronger marshmallow taste (greater marshmallows-to-crackers ratio)?
Solve for \(x\) in the equation \(\frac{5}{3}=\frac{8}{x}\)?
Three recipes for orange juice are shown below. Put the recipes in order from the one with the smallest fraction of orange concentrate to the one with the greatest fraction of orange concentrate.

References
Tjoe, H., & Torre, J. de la. (2014). The identification and validation process of proportional reasoning attributes: an application of a cognitive diagnosis modeling framework. Mathematics Education Research Journal, 26(2), 237–255. https://doi.org/10.1007/s13394-013-0090-7