4.4 GDINA model estimation
To estimate G-DINA model, call GDINA function and specify the data and Q-matrix as the first two arguments.
Returned fit1 contains (almost) all estimation results. It is called an object of class GDINA, and we can apply various methods to it. To print some general model estimation information, type fit1 in Rstudio console:
## Call:
## GDINA(dat = data1, Q = Q1, verbose = 0)
##
## GDINA version 2.9.4 (2023-07-01)
## ===============================================
## Data
## -----------------------------------------------
## # of individuals    groups    items
##              837         1       15
## ===============================================
## Model
## -----------------------------------------------
## Fitted model(s)       = GDINA
## Attribute structure   = saturated
## Attribute level       = Dichotomous
## ===============================================
## Estimation
## -----------------------------------------------
## Number of iterations  = 288
##
## For the final iteration:
##   Max abs change in item success prob. = 0.0001
##   Max abs change in mixing proportions = 0.0000
##   Change in -2 log-likelihood          = 0.0001
##   Converged?                           = TRUE
##
## Time used             = 0.422 secs
As shown above, some information about the data, fitted model and calibration was printed. Such information can be used to check the model specification and evaluate convergence (By default, the maximum iterations allowed is 2000).
summary is another function that can be applied to objects of class GDINA. Specify fit1 as the input:
##
## Test Fit Statistics
##
## Loglik = -7431.45
##
## AIC    = 14996.91  | penalty [2 * p]  = 134.00
## BIC    = 15313.81  | penalty [log(n) * p]  = 450.90
## CAIC   = 15380.81  | penalty [(log(n) + 1) * p]  = 517.90
## SABIC  = 15101.04  | penalty [log((n + 2)/24) * p]  = 238.13
##
## No. of parameters (p)  = 67
##   No. of estimated item parameters =  60
##   No. of fixed item parameters =  0
##   No. of distribution parameters =  7
##
## Attribute Prevalence
##
##    Level0 Level1
## A1   0.37   0.63
## A2   0.46   0.54
## A3   0.29   0.71
As shown above, the summary function prints some test fit statistics,
like AIC and BIC, the number of parameters and attribute prevalence. The
attribute prevalence gives the proportion of individuals who master (or
do not master) each attribute, labelled as Level1'' (orLevel0’’).
To extract item parameters, we can use coef function, as in
## $`Item 1`
## P(0) P(1)
## 0.93 0.98
##
## $`Item 2`
## P(0) P(1)
## 0.26 0.82
##
## $`Item 3`
## P(0) P(1)
## 0.54 0.82
##
## $`Item 4`
## P(0) P(1)
## 0.48 0.87
##
## $`Item 5`
## P(00) P(10) P(01) P(11)
## 0.29 0.73 0.54 0.89
##
## $`Item 6`
## P(00) P(10) P(01) P(11)
## 0.157 0.441 0.046 0.757
##
## $`Item 7`
## P(00) P(10) P(01) P(11)
## 0.0001 0.5172 0.5316 0.7762
##
## $`Item 8`
## P(00) P(10) P(01) P(11)
## 0.04 0.67 0.35 0.80
##
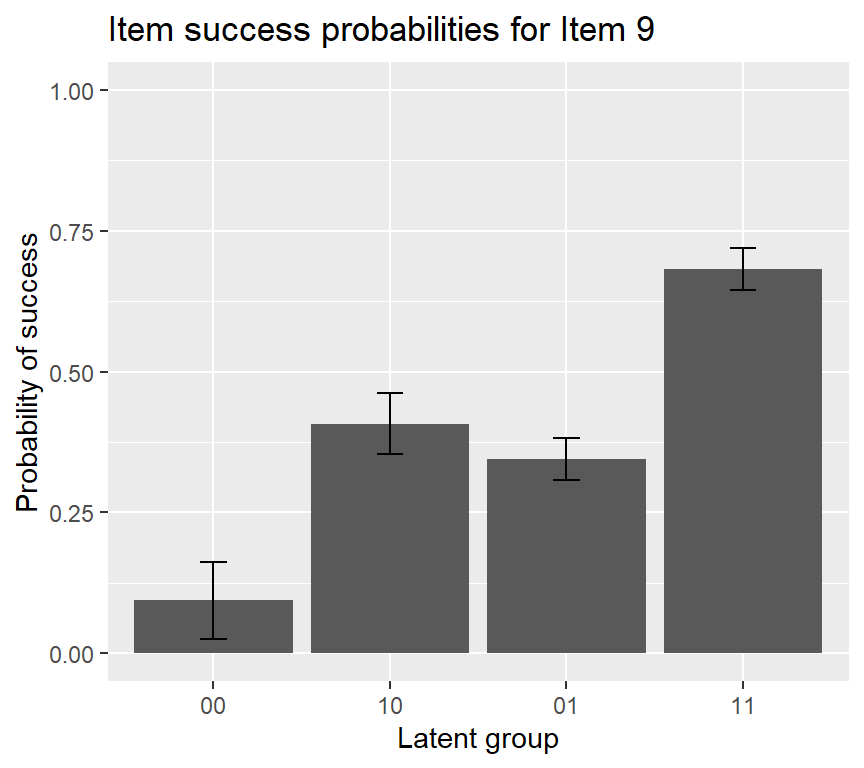
## $`Item 9`
## P(00) P(10) P(01) P(11)
## 0.094 0.407 0.345 0.682
##
## $`Item 10`
## P(00) P(10) P(01) P(11)
## 0.43 0.71 0.36 0.77
##
## $`Item 11`
## P(00) P(10) P(01) P(11)
## 0.49 0.62 0.73 0.91
##
## $`Item 12`
## P(00) P(10) P(01) P(11)
## 0.19 0.34 0.36 0.68
##
## $`Item 13`
## P(00) P(10) P(01) P(11)
## 0.20 0.19 0.31 0.59
##
## $`Item 14`
## P(000) P(100) P(010) P(001) P(110) P(101) P(011) P(111)
## 0.076 1.000 0.024 0.236 0.612 0.411 0.087 0.650
##
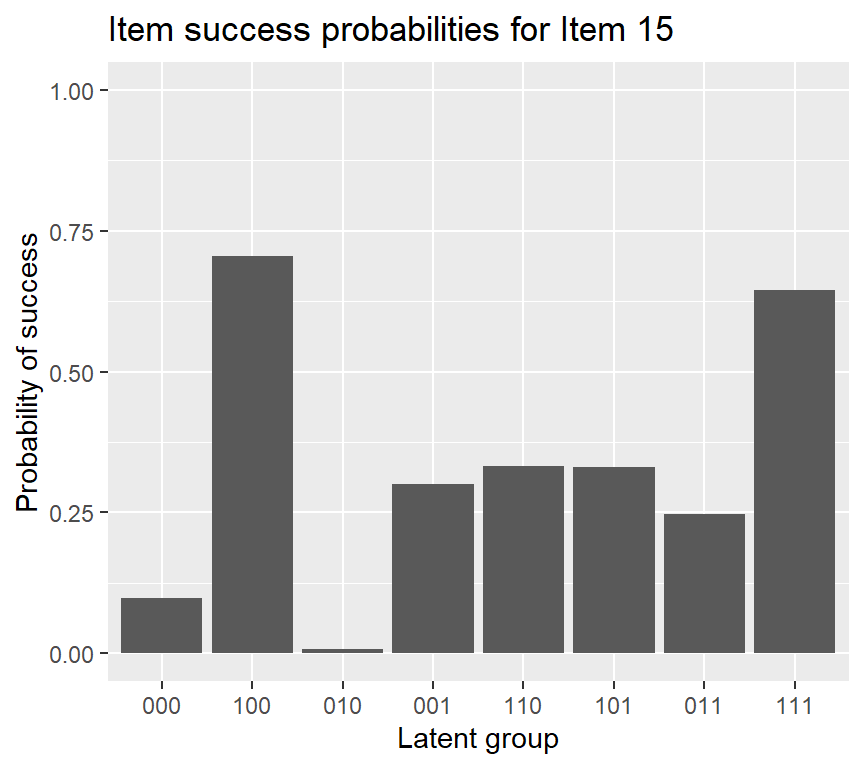
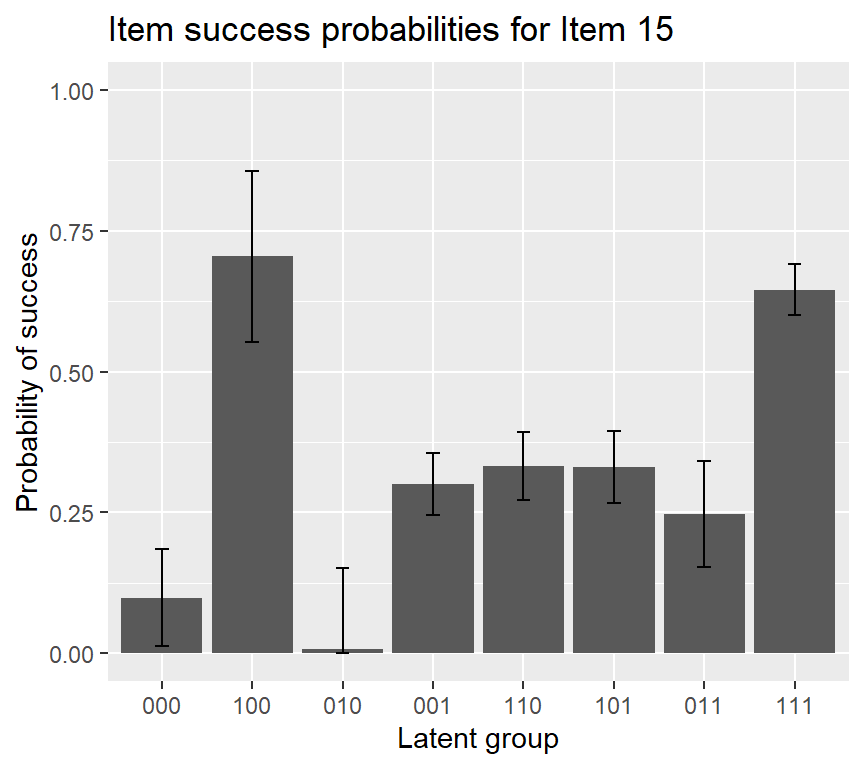
## $`Item 15`
## P(000) P(100) P(010) P(001) P(110) P(101) P(011) P(111)
## 0.0989 0.7047 0.0072 0.3002 0.3321 0.3307 0.2473 0.6451The returned output by coef (when we only specify the first argument) is item success probabilities for each latent group (reduced latent classes).
coef has a few arguments including what,with SE and SE.type. what specifies what to show; It can be “itemprob” for item success probabilities, “gs” for guessing and slip parameters, “delta” for delta parameters, “rrum” for RRUM parameters when items are estimated using RRUM, “LCprob” for item success probabilities for all latent classes, and “lambda” for structural parameters of joint attribute distribution (such as higher-order structural parameters).
Set withSE=TRUE if you want to estimate standard errors. Note that standard errors can only be calculated for item success probabilities, guessing and slip parameters, and delta parameters. For other parameters, you can use function bootSE to calculate standard errors using bootstrap procedures. SE.type can be 1, 2 or 3, indicating outer product of gradient (OPG) estimates based on itemwise, incomplete or complete information matrix. Default is 2. Currently, the OPG method based on the complete information matrix assumes that all latent classes are identifiable and is only available for saturated joint attribute distribution.
##      P(000) P(100) P(010) P(001) P(110) P(101) P(011) P(111)
## Est.  0.099   0.70 0.0072  0.300   0.33  0.331  0.247  0.645
## S.E. 0.086 0.15 0.1438 0.055 0.06 0.064 0.094 0.045## d0 d1 d2 d3 d12 d13 d23 d123
## Est. 0.099 0.61 -0.092 0.20 -0.28 -0.58 0.039 0.65
## S.E. 0.086 0.18 0.174 0.12 0.26 0.22 0.241 0.33Code
## p(000) p(100) p(010) p(001) p(110) p(101) p(011) p(111)
##  0.061  0.031  0.037  0.186  0.157  0.181  0.084  0.262
To plot the probabilities of success for each item \(P(X_{ij}=1|\mathbf{\alpha}_{lj}^*)\), we can use plot:

If we want to add an error bar to the IRF plot of item 15, using the following code:
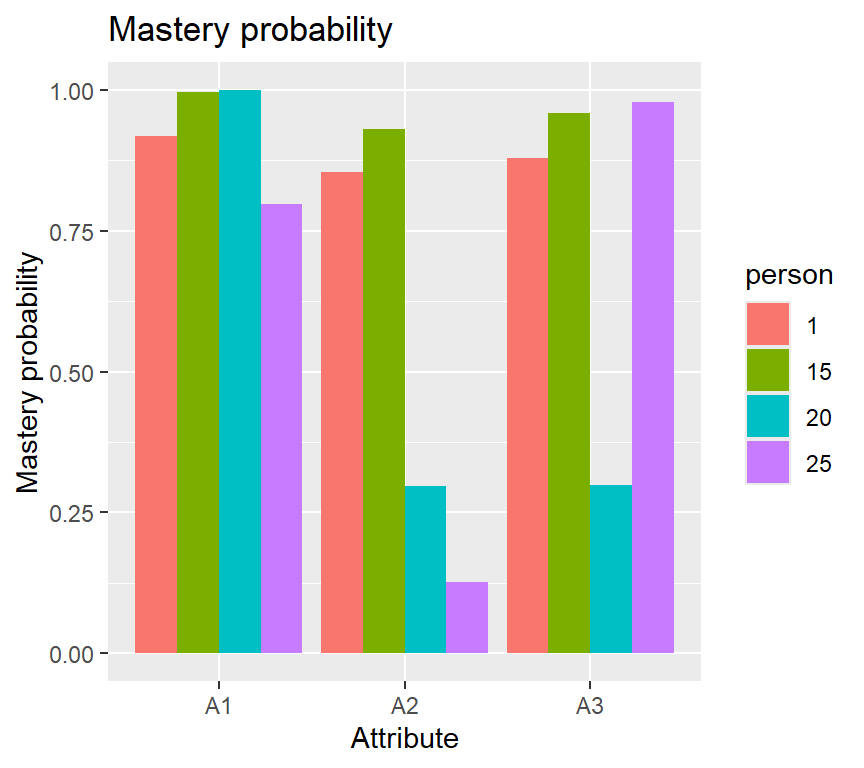
To obtain attribute estimates, use the function personparm:
##      A1 A2 A3
## [1,]  1  1  1
## [2,]  0  0  1
## [3,]  1  1  0
## [4,]  1  1  0
## [5,]  1  0  0
## [6,]  1  1  0
You can also plot probabilities of mastering each attribute for individuals 1, 15, 20 and 25:
To extract other elements, we should use extract function. Its first input should be an object returned from GDINA function (or other functions), and its second input (i.e., what) specifies what to extract. See its help page ?extract for a complete list of elements that can be extracted.
For example, to calculate the discrimination indices, the following code can be used:
##         P(1)-P(0)     GDI
## Item 1      0.052 0.00062
## Item 2      0.559 0.06395
## Item 3      0.287 0.02043
## Item 4      0.390 0.03111
## Item 5      0.604 0.05942
## Item 6      0.600 0.08040
## Item 7      0.776 0.09399
## Item 8      0.764 0.06416
## Item 9      0.589 0.03483
## Item 10     0.341 0.03629
## Item 11     0.418 0.01827
## Item 12     0.496 0.03461
## Item 13     0.393 0.03068
## Item 14     0.574 0.05892
## Item 15     0.546 0.03519
To calculate the proportion of individuals in each latent class, we can use:
##        000   100   010  001  110  101   011  111
## [1,] 0.062 0.031 0.037 0.19 0.16 0.18 0.084 0.26