Exercise 1 - data wrangling
Introduction
For this homework exercise, use the functions that were introduced in class to solve the following problems. You shouldn’t have to use any functions that are not covered in class! The course book should be your first point of reference as you tackle the problems.
Questions
1. Assign a variable
Why does this code chunk not work?
stringlenght <- 10

stringlength
Look carefully! (This may seem like an exercise in pointlessness, but training your brain to notice even the tiniest difference will pay off when programming.)
Solution
First, the code chunk was missing the {r} portion.
Second, the object name is spelled differently in each case: it ends with ht in the first line, and th in the second.
2. Reducing the size of your data set
Starting with the {mpg} data frame, use filter() and select() to create a single table that contains only the following records and variables:
compact and subcompact Volkswagens from the model year 1999
manufacturer, model, mileage in both city and highway
Solution
First, view the data table:
mpg## # A tibble: 234 × 12
## manufacturer model displ year cyl trans drv cty hwy fl class mpg_per_cubic_litre
## <chr> <chr> <dbl> <int> <int> <chr> <chr> <int> <int> <chr> <chr> <dbl>
## 1 audi a4 1.8 1999 4 auto… f 18 29 p comp… 16.1
## 2 audi a4 1.8 1999 4 manu… f 21 29 p comp… 16.1
## 3 audi a4 2 2008 4 manu… f 20 31 p comp… 15.5
## 4 audi a4 2 2008 4 auto… f 21 30 p comp… 15
## 5 audi a4 2.8 1999 6 auto… f 16 26 p comp… 9.29
## 6 audi a4 2.8 1999 6 manu… f 18 26 p comp… 9.29
## 7 audi a4 3.1 2008 6 auto… f 18 27 p comp… 8.71
## 8 audi a4 quattro 1.8 1999 4 manu… 4 18 26 p comp… 14.4
## 9 audi a4 quattro 1.8 1999 4 auto… 4 16 25 p comp… 13.9
## 10 audi a4 quattro 2 2008 4 manu… 4 20 28 p comp… 14
## # ℹ 224 more rowsIn this first solution, each evaluation gets its own filter() function:
mpg |>
  filter(manufacturer == "volkswagen")  |>
  filter(class == "compact" | class == "subcompact")  |>   ##  - use of "OR" `|` instead of `%in%`
  filter(year == 1999) |>
  select(manufacturer, model, cty, hwy)
## # A tibble: 12 × 4
## manufacturer model cty hwy
## <chr> <chr> <int> <int>
## 1 volkswagen gti 21 29
## 2 volkswagen gti 19 26
## 3 volkswagen gti 17 24
## 4 volkswagen jetta 33 44
## 5 volkswagen jetta 21 29
## 6 volkswagen jetta 19 26
## 7 volkswagen jetta 16 23
## 8 volkswagen jetta 17 24
## 9 volkswagen new beetle 35 44
## 10 volkswagen new beetle 29 41
## 11 volkswagen new beetle 21 29
## 12 volkswagen new beetle 19 26Another possible solution combines the three evaluations into a single filter() function:
mpg |>
  filter(manufacturer == "volkswagen",
         class %in% c("compact", "subcompact"),
         year == 1999) |>
  select(manufacturer, model, cty, hwy)
## # A tibble: 12 × 4
## manufacturer model cty hwy
## <chr> <chr> <int> <int>
## 1 volkswagen gti 21 29
## 2 volkswagen gti 19 26
## 3 volkswagen gti 17 24
## 4 volkswagen jetta 33 44
## 5 volkswagen jetta 21 29
## 6 volkswagen jetta 19 26
## 7 volkswagen jetta 16 23
## 8 volkswagen jetta 17 24
## 9 volkswagen new beetle 35 44
## 10 volkswagen new beetle 29 41
## 11 volkswagen new beetle 21 29
## 12 volkswagen new beetle 19 26In this variant, the filter() function uses “&” instead of commas at the end of each evaluation:
## variant
mpg |>
  filter(manufacturer == "volkswagen" &   # use of "&" instead of commas in filter
         class %in% c("compact", "subcompact") &
         year == 1999) |>
  select(manufacturer, model, cty, hwy)
## # A tibble: 12 × 4
## manufacturer model cty hwy
## <chr> <chr> <int> <int>
## 1 volkswagen gti 21 29
## 2 volkswagen gti 19 26
## 3 volkswagen gti 17 24
## 4 volkswagen jetta 33 44
## 5 volkswagen jetta 21 29
## 6 volkswagen jetta 19 26
## 7 volkswagen jetta 16 23
## 8 volkswagen jetta 17 24
## 9 volkswagen new beetle 35 44
## 10 volkswagen new beetle 29 41
## 11 volkswagen new beetle 21 29
## 12 volkswagen new beetle 19 263. Selecting variables
What happens if you include the name of a variable twice in a select() call? Demonstrate using the {gapminder} data. (The package is installed in the workspace, but you will have to load it to access it…)
Solution
The variable is not duplicated. In the example below, the variable “year” is duplicated but it appears only once in the output from the select() function.
gapminder |>
  select(country, year, lifeExp, year)
## # A tibble: 1,704 × 3
## country year lifeExp
## <fct> <int> <dbl>
## 1 Afghanistan 1952 28.8
## 2 Afghanistan 1957 30.3
## 3 Afghanistan 1962 32.0
## 4 Afghanistan 1967 34.0
## 5 Afghanistan 1972 36.1
## 6 Afghanistan 1977 38.4
## 7 Afghanistan 1982 39.9
## 8 Afghanistan 1987 40.8
## 9 Afghanistan 1992 41.7
## 10 Afghanistan 1997 41.8
## # ℹ 1,694 more rows4. R Markdown
The following chunk of code produces a chart. When this notebook is previewed, the R code inside the chunk is also rendered.
Enter a chunk option so that the chart shows in the output, but the code does not.
(Hint: use the RMarkdown cheatsheet to find the solution!)
# hide this code!
ggplot(data = mpg) +
  geom_point(mapping = aes(x = displ, y = hwy))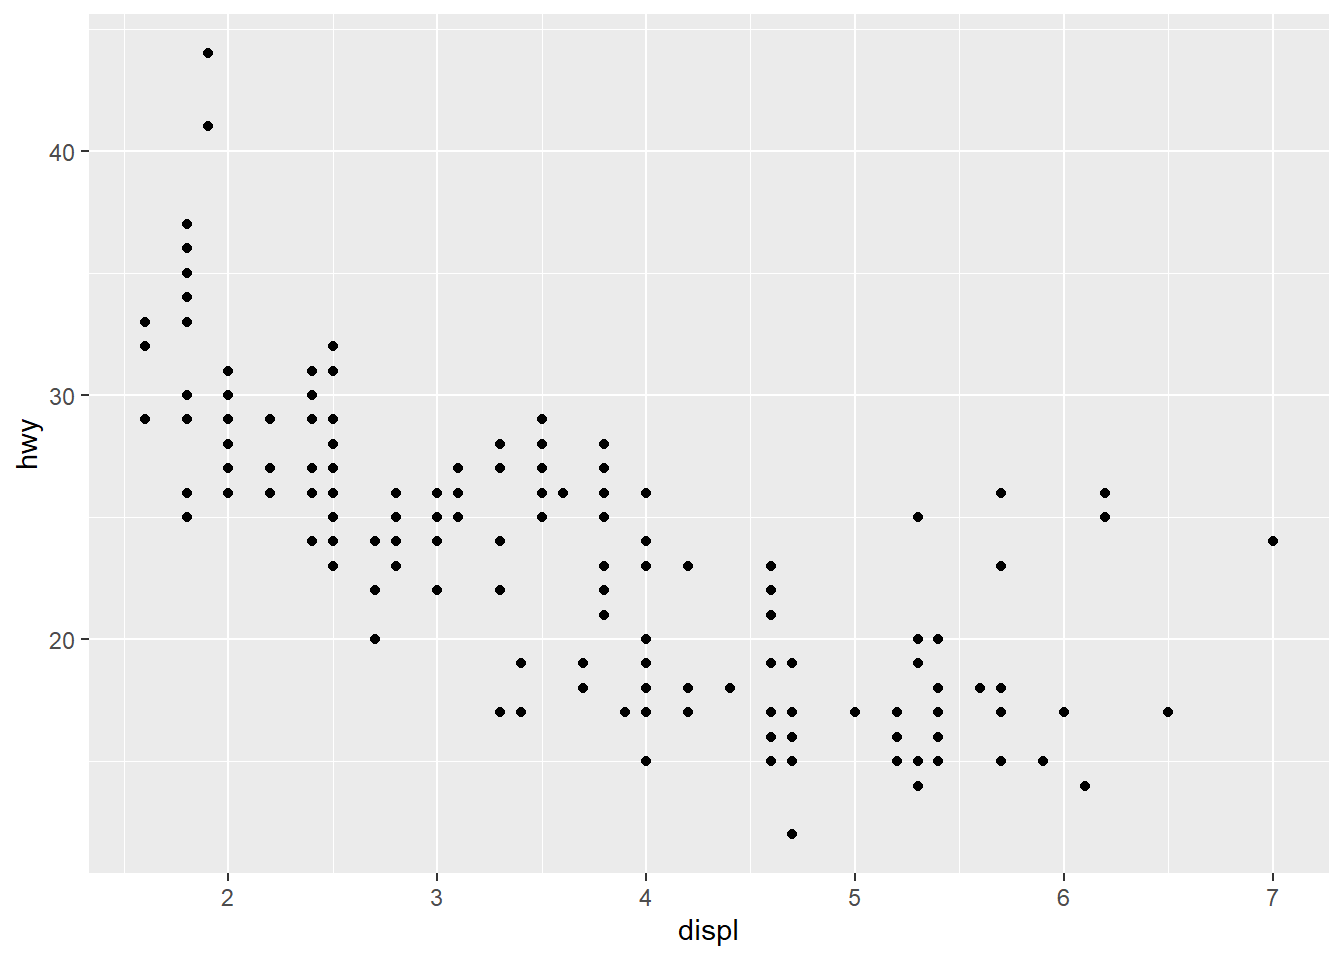
Solution
The solution is to put the option “echo = FALSE” after the “r” in the opening of the code chunk.
There are other options that can also control the behaviour of the code and its output. For more details, see the R Markdown cheat sheet.
{r, echo=FALSE}
5. Flight data
For Q3a-3d, use the data nycflights13::flights
Sidebar: To see the names of all of the tables in the {nycflights13} package, use the
data()function:
data(package = "nycflights13")Pay close attention to how the variables are coded. Type ?flights into the console to access the details about this data in the “Help” pane.
Using the data in the nycflights13::flights table, find all flights that:
Had an arrival delay of two or more hours
Flew to Houston (there are two airports, with the codes IAH or HOU)
Were operated by United, American, or Delta (you may want to review the separate airlines table to check the codes for each airline)
Departed in summer (July, August, and September)
Solution
Solution a
a. Had an arrival delay of two or more hours
Note that variable arr_delay is measured in minutes, so we need to find the flights where that’s greater than or equal to 120 minutes.
filter(flights, arr_delay >= 120)## year month day dep_time sched_dep_time dep_delay arr_time sched_arr_time arr_delay carrier
## 1 2013 1 1 811 630 101 1047 830 137 MQ
## 2 2013 1 1 848 1835 853 1001 1950 851 MQ
## 3 2013 1 1 957 733 144 1056 853 123 UA
## 4 2013 1 1 1114 900 134 1447 1222 145 UA
## 5 2013 1 1 1505 1310 115 1638 1431 127 EV
## 6 2013 1 1 1525 1340 105 1831 1626 125 B6
## 7 2013 1 1 1549 1445 64 1912 1656 136 EV
## 8 2013 1 1 1558 1359 119 1718 1515 123 EV
## 9 2013 1 1 1732 1630 62 2028 1825 123 EV
## 10 2013 1 1 1803 1620 103 2008 1750 138 MQ
## 11 2013 1 1 1815 1325 290 2120 1542 338 EV
## 12 2013 1 1 1842 1422 260 1958 1535 263 EV
## 13 2013 1 1 1856 1645 131 2212 2005 127 AA
## 14 2013 1 1 1934 1725 129 2126 1855 151 MQ
## 15 2013 1 1 1938 1703 155 2109 1823 166 EV
## 16 2013 1 1 1942 1705 157 2124 1830 174 MQ
## 17 2013 1 1 2006 1630 216 2230 1848 222 EV
## 18 2013 1 1 2009 1808 121 2145 1942 123 EV
## 19 2013 1 1 2115 1700 255 2330 1920 250 9E
## 20 2013 1 1 2119 1930 109 2358 2136 142 EV
## 21 2013 1 1 2205 1720 285 46 2040 246 AA
## 22 2013 1 1 2221 2000 141 2331 2124 127 EV
## 23 2013 1 1 2312 2000 192 21 2110 191 EV
## 24 2013 1 1 2343 1724 379 314 1938 456 EV
## 25 2013 1 2 126 2250 156 233 2359 154 B6
## 26 2013 1 2 817 630 107 1107 845 142 EV
## 27 2013 1 2 833 558 155 1018 727 171 UA
## 28 2013 1 2 923 624 179 1051 758 173 EV
## 29 2013 1 2 1244 900 224 1431 1104 207 EV
## 30 2013 1 2 1332 904 268 1616 1128 288 EV
## 31 2013 1 2 1412 838 334 1710 1147 323 UA
## 32 2013 1 2 1451 1232 139 1749 1533 136 UA
## 33 2013 1 2 1548 1340 128 1710 1500 130 EV
## 34 2013 1 2 1607 1030 337 2003 1355 368 AA
## 35 2013 1 2 1710 1526 104 1857 1655 122 EV
## 36 2013 1 2 1728 1515 133 1843 1632 131 EV
## 37 2013 1 2 1751 1450 181 2041 1755 166 AA
## 38 2013 1 2 1755 1547 128 1929 1708 141 EV
## 39 2013 1 2 1806 1629 97 2008 1808 120 EV
## 40 2013 1 2 1845 1645 120 2137 1859 158 9E
## 41 2013 1 2 1848 1701 107 2112 1856 136 EV
## 42 2013 1 2 1909 1621 168 2116 1816 180 EV
## 43 2013 1 2 2005 1705 180 2126 1830 176 MQ
## 44 2013 1 2 2043 1759 164 2251 1949 182 EV
## 45 2013 1 2 2115 1837 158 2322 2045 157 EV
## 46 2013 1 2 2131 1512 379 2340 1741 359 UA
## 47 2013 1 2 2145 1925 140 54 2244 130 DL
## 48 2013 1 2 2225 1930 175 231 2219 252 EV
## 49 2013 1 3 50 2145 185 203 2311 172 B6
## 50 2013 1 3 235 2359 156 700 437 143 B6
## 51 2013 1 3 854 630 144 1057 810 167 AA
## 52 2013 1 3 909 700 129 1103 850 133 AA
## flight tailnum origin dest air_time distance hour minute time_hour
## 1 4576 N531MQ LGA CLT 118 544 6 30 2013-01-01T11:00:00Z
## 2 3944 N942MQ JFK BWI 41 184 18 35 2013-01-01T23:00:00Z
## 3 856 N534UA EWR BOS 37 200 7 33 2013-01-01T12:00:00Z
## 4 1086 N76502 LGA IAH 248 1416 9 0 2013-01-01T14:00:00Z
## 5 4497 N17984 EWR RIC 63 277 13 10 2013-01-01T18:00:00Z
## 6 525 N231JB EWR MCO 152 937 13 40 2013-01-01T18:00:00Z
## 7 4181 N21197 EWR MCI 234 1092 14 45 2013-01-01T19:00:00Z
## 8 5712 N826AS JFK IAD 53 228 13 59 2013-01-01T18:00:00Z
## 9 4092 N16911 EWR DAY 119 533 16 30 2013-01-01T21:00:00Z
## 10 4622 N504MQ LGA BNA 154 764 16 20 2013-01-01T21:00:00Z
## 11 4417 N17185 EWR OMA 213 1134 13 25 2013-01-01T18:00:00Z
## 12 4633 N18120 EWR BTV 46 266 14 22 2013-01-01T19:00:00Z
## 13 181 N323AA JFK LAX 336 2475 16 45 2013-01-01T21:00:00Z
## 14 4255 N909MQ JFK BNA 154 765 17 25 2013-01-01T22:00:00Z
## 15 4300 N18557 EWR RIC 68 277 17 3 2013-01-01T22:00:00Z
## 16 4410 N835MQ JFK DCA 60 213 17 5 2013-01-01T22:00:00Z
## 17 4644 N14972 EWR SAV 121 708 16 30 2013-01-01T21:00:00Z
## 18 4440 N14143 EWR PIT 65 319 18 8 2013-01-01T23:00:00Z
## 19 3347 N924XJ JFK CVG 115 589 17 0 2013-01-01T22:00:00Z
## 20 4543 N13123 EWR DSM 200 1017 19 30 2013-01-02T00:00:00Z
## 21 1999 N5DNAA EWR MIA 146 1085 17 20 2013-01-01T22:00:00Z
## 22 4462 N13566 EWR BUF 56 282 20 0 2013-01-02T01:00:00Z
## 23 4312 N13958 EWR DCA 44 199 20 0 2013-01-02T01:00:00Z
## 24 4321 N21197 EWR MCI 222 1092 17 24 2013-01-01T22:00:00Z
## 25 22 N636JB JFK SYR 49 209 22 50 2013-01-03T03:00:00Z
## 26 4235 N16546 EWR IND 132 645 6 30 2013-01-02T11:00:00Z
## 27 651 N448UA EWR ORD 129 719 5 58 2013-01-02T10:00:00Z
## 28 4104 N13975 EWR PIT 61 319 6 24 2013-01-02T11:00:00Z
## 29 4412 N13958 EWR MYR 94 550 9 0 2013-01-02T14:00:00Z
## 30 4364 N41104 EWR MCI 203 1092 9 4 2013-01-02T14:00:00Z
## 31 468 N474UA EWR MCO 150 937 8 38 2013-01-02T13:00:00Z
## 32 1121 N33284 EWR FLL 158 1065 12 32 2013-01-02T17:00:00Z
## 33 4617 N10575 EWR PIT 63 319 13 40 2013-01-02T18:00:00Z
## 34 179 N324AA JFK SFO 346 2586 10 30 2013-01-02T15:00:00Z
## 35 4502 N21537 EWR BNA 148 748 15 26 2013-01-02T20:00:00Z
## 36 4133 N13975 EWR IAD 48 212 15 15 2013-01-02T20:00:00Z
## 37 1813 N5FFAA JFK MCO 149 944 14 50 2013-01-02T19:00:00Z
## 38 3272 N21130 EWR BUF 51 282 15 47 2013-01-02T20:00:00Z
## 39 4308 N13550 EWR RDU 78 416 16 29 2013-01-02T21:00:00Z
## 40 3983 N8412F EWR CVG 131 569 16 45 2013-01-02T21:00:00Z
## 41 4202 N14953 EWR STL 176 872 17 1 2013-01-02T22:00:00Z
## 42 4092 N13553 EWR DAY 102 533 16 21 2013-01-02T21:00:00Z
## 43 4410 N810MQ JFK DCA 49 213 17 5 2013-01-02T22:00:00Z
## 44 4581 N18557 EWR CMH 103 463 17 59 2013-01-02T22:00:00Z
## 45 4125 N41104 EWR GRR 113 605 18 37 2013-01-02T23:00:00Z
## 46 488 N593UA LGA DEN 228 1620 15 12 2013-01-02T20:00:00Z
## 47 2139 N368NW LGA MIA 159 1096 19 25 2013-01-03T00:00:00Z
## 48 4204 N21130 EWR OKC 286 1325 19 30 2013-01-03T00:00:00Z
## 49 104 N329JB JFK BUF 58 301 21 45 2013-01-04T02:00:00Z
## 50 727 N618JB JFK BQN 186 1576 23 59 2013-01-04T04:00:00Z
## 51 303 N3DFAA LGA ORD 133 733 6 30 2013-01-03T11:00:00Z
## 52 305 N201AA LGA ORD 138 733 7 0 2013-01-03T12:00:00Z
## [ reached 'max' / getOption("max.print") -- omitted 10148 rows ]Solution b
b. Flew to Houston (there are two airports, with the codes IAH or HOU)
filter(flights, dest == "IAH" | dest == "HOU")## year month day dep_time sched_dep_time dep_delay arr_time sched_arr_time arr_delay carrier
## 1 2013 1 1 517 515 2 830 819 11 UA
## 2 2013 1 1 533 529 4 850 830 20 UA
## 3 2013 1 1 623 627 -4 933 932 1 UA
## 4 2013 1 1 728 732 -4 1041 1038 3 UA
## 5 2013 1 1 739 739 0 1104 1038 26 UA
## 6 2013 1 1 908 908 0 1228 1219 9 UA
## 7 2013 1 1 1028 1026 2 1350 1339 11 UA
## 8 2013 1 1 1044 1045 -1 1352 1351 1 UA
## 9 2013 1 1 1114 900 134 1447 1222 145 UA
## 10 2013 1 1 1205 1200 5 1503 1505 -2 UA
## 11 2013 1 1 1208 1158 10 1540 1502 38 B6
## 12 2013 1 1 1248 1250 -2 1607 1607 0 UA
## 13 2013 1 1 1306 1300 6 1622 1610 12 WN
## 14 2013 1 1 1356 1350 6 1659 1640 19 UA
## 15 2013 1 1 1430 1430 0 1735 1744 -9 UA
## 16 2013 1 1 1527 1515 12 1854 1810 44 UA
## 17 2013 1 1 1620 1620 0 1945 1922 23 UA
## 18 2013 1 1 1702 1700 2 2044 2028 16 UA
## 19 2013 1 1 1708 1700 8 2037 2005 32 WN
## 20 2013 1 1 1725 1720 5 2045 2021 24 UA
## 21 2013 1 1 1855 1848 7 2203 2200 3 UA
## 22 2013 1 1 1959 2000 -1 2310 2307 3 UA
## 23 2013 1 1 2030 2035 -5 2354 2342 12 B6
## 24 2013 1 1 2031 2030 1 2344 2335 9 UA
## 25 2013 1 2 512 515 -3 809 819 -10 UA
## 26 2013 1 2 536 529 7 840 828 12 UA
## 27 2013 1 2 625 629 -4 935 934 1 UA
## 28 2013 1 2 732 732 0 1047 1040 7 UA
## 29 2013 1 2 734 700 34 1045 1025 20 WN
## 30 2013 1 2 752 745 7 1055 1042 13 UA
## 31 2013 1 2 859 900 -1 1204 1220 -16 UA
## 32 2013 1 2 913 908 5 1252 1215 37 UA
## 33 2013 1 2 1027 1026 1 1328 1339 -11 UA
## 34 2013 1 2 1057 1045 12 1406 1351 15 UA
## 35 2013 1 2 1156 1158 -2 1517 1502 15 B6
## 36 2013 1 2 1200 1200 0 1513 1505 8 UA
## 37 2013 1 2 1251 1250 1 1552 1603 -11 UA
## 38 2013 1 2 1319 1305 14 1633 1615 18 WN
## 39 2013 1 2 1353 1350 3 1648 1640 8 UA
## 40 2013 1 2 1431 1430 1 1745 1744 1 UA
## 41 2013 1 2 1521 1515 6 1814 1810 4 UA
## 42 2013 1 2 1618 1620 -2 1931 1922 9 UA
## 43 2013 1 2 1708 1700 8 2035 2028 7 UA
## 44 2013 1 2 1729 1720 9 2040 2021 19 UA
## 45 2013 1 2 1810 1655 75 2146 2000 106 WN
## 46 2013 1 2 1915 1848 27 2225 2200 25 UA
## 47 2013 1 2 1950 1940 10 2236 2241 -5 UA
## 48 2013 1 2 2031 2035 -4 2353 2342 11 B6
## 49 2013 1 2 2101 2035 26 7 2340 27 UA
## 50 2013 1 3 520 525 -5 830 820 10 UA
## 51 2013 1 3 532 530 2 851 831 20 UA
## 52 2013 1 3 636 625 11 945 932 13 UA
## flight tailnum origin dest air_time distance hour minute time_hour
## 1 1545 N14228 EWR IAH 227 1400 5 15 2013-01-01T10:00:00Z
## 2 1714 N24211 LGA IAH 227 1416 5 29 2013-01-01T10:00:00Z
## 3 496 N459UA LGA IAH 229 1416 6 27 2013-01-01T11:00:00Z
## 4 473 N488UA LGA IAH 238 1416 7 32 2013-01-01T12:00:00Z
## 5 1479 N37408 EWR IAH 249 1400 7 39 2013-01-01T12:00:00Z
## 6 1220 N12216 EWR IAH 233 1400 9 8 2013-01-01T14:00:00Z
## 7 1004 N76508 LGA IAH 237 1416 10 26 2013-01-01T15:00:00Z
## 8 455 N667UA EWR IAH 229 1400 10 45 2013-01-01T15:00:00Z
## 9 1086 N76502 LGA IAH 248 1416 9 0 2013-01-01T14:00:00Z
## 10 1461 N39418 EWR IAH 221 1400 12 0 2013-01-01T17:00:00Z
## 11 625 N239JB JFK HOU 253 1428 11 58 2013-01-01T16:00:00Z
## 12 1280 N26210 LGA IAH 238 1416 12 50 2013-01-01T17:00:00Z
## 13 2596 N773SA EWR HOU 239 1411 13 0 2013-01-01T18:00:00Z
## 14 1258 N26906 EWR IAH 218 1400 13 50 2013-01-01T18:00:00Z
## 15 997 N452UA LGA IAH 227 1416 14 30 2013-01-01T19:00:00Z
## 16 1695 N69059 EWR IAH 210 1400 15 15 2013-01-01T20:00:00Z
## 17 1178 N18119 EWR IAH 242 1400 16 20 2013-01-01T21:00:00Z
## 18 1259 N16632 LGA IAH 234 1416 17 0 2013-01-01T22:00:00Z
## 19 1066 N778SW EWR HOU 245 1411 17 0 2013-01-01T22:00:00Z
## 20 1712 N17122 EWR IAH 235 1400 17 20 2013-01-01T22:00:00Z
## 21 1128 N36207 LGA IAH 231 1416 18 48 2013-01-01T23:00:00Z
## 22 1233 N76514 EWR IAH 232 1400 20 0 2013-01-02T01:00:00Z
## 23 629 N192JB JFK HOU 245 1428 20 35 2013-01-02T01:00:00Z
## 24 834 N822UA EWR IAH 223 1400 20 30 2013-01-02T01:00:00Z
## 25 1453 N76515 EWR IAH 214 1400 5 15 2013-01-02T10:00:00Z
## 26 407 N493UA LGA IAH 231 1416 5 29 2013-01-02T10:00:00Z
## 27 473 N461UA LGA IAH 230 1416 6 29 2013-01-02T11:00:00Z
## 28 1509 N73291 LGA IAH 230 1416 7 32 2013-01-02T12:00:00Z
## 29 20 N485WN EWR HOU 235 1411 7 0 2013-01-02T12:00:00Z
## 30 251 N430UA EWR IAH 215 1400 7 45 2013-01-02T12:00:00Z
## 31 667 N843UA LGA IAH 230 1416 9 0 2013-01-02T14:00:00Z
## 32 493 N561UA EWR IAH 227 1400 9 8 2013-01-02T14:00:00Z
## 33 1563 N14704 LGA IAH 219 1416 10 26 2013-01-02T15:00:00Z
## 34 491 N677UA EWR IAH 226 1400 10 45 2013-01-02T15:00:00Z
## 35 625 N192JB JFK HOU 241 1428 11 58 2013-01-02T16:00:00Z
## 36 1461 N27724 EWR IAH 232 1400 12 0 2013-01-02T17:00:00Z
## 37 633 N514UA LGA IAH 225 1416 12 50 2013-01-02T17:00:00Z
## 38 3294 N950WN EWR HOU 240 1411 13 5 2013-01-02T18:00:00Z
## 39 1153 N45905 EWR IAH 208 1400 13 50 2013-01-02T18:00:00Z
## 40 566 N847UA LGA IAH 237 1416 14 30 2013-01-02T19:00:00Z
## 41 1695 N76054 EWR IAH 205 1400 15 15 2013-01-02T20:00:00Z
## 42 1178 N14115 EWR IAH 220 1400 16 20 2013-01-02T21:00:00Z
## 43 1259 N24633 LGA IAH 238 1416 17 0 2013-01-02T22:00:00Z
## 44 1125 N34131 EWR IAH 226 1400 17 20 2013-01-02T22:00:00Z
## 45 2529 N901WN EWR HOU 243 1411 16 55 2013-01-02T21:00:00Z
## 46 1128 N73283 LGA IAH 230 1416 18 48 2013-01-02T23:00:00Z
## 47 1221 N23708 EWR IAH 209 1400 19 40 2013-01-03T00:00:00Z
## 48 629 N273JB JFK HOU 244 1428 20 35 2013-01-03T01:00:00Z
## 49 834 N454UA EWR IAH 223 1400 20 35 2013-01-03T01:00:00Z
## 50 1018 N78511 EWR IAH 238 1400 5 25 2013-01-03T10:00:00Z
## 51 1136 N76522 LGA IAH 241 1416 5 30 2013-01-03T10:00:00Z
## 52 468 N412UA LGA IAH 229 1416 6 25 2013-01-03T11:00:00Z
## [ reached 'max' / getOption("max.print") -- omitted 9261 rows ]Note that you could also use %in%
##    year month day dep_time sched_dep_time dep_delay arr_time sched_arr_time arr_delay carrier
## 1  2013     1   1      517            515         2      830            819        11      UA
## 2  2013     1   1      533            529         4      850            830        20      UA
## 3  2013     1   1      623            627        -4      933            932         1      UA
## 4  2013     1   1      728            732        -4     1041           1038         3      UA
## 5  2013     1   1      739            739         0     1104           1038        26      UA
## 6  2013     1   1      908            908         0     1228           1219         9      UA
## 7  2013     1   1     1028           1026         2     1350           1339        11      UA
## 8  2013     1   1     1044           1045        -1     1352           1351         1      UA
## 9  2013     1   1     1114            900       134     1447           1222       145      UA
## 10 2013     1   1     1205           1200         5     1503           1505        -2      UA
## 11 2013     1   1     1208           1158        10     1540           1502        38      B6
## 12 2013     1   1     1248           1250        -2     1607           1607         0      UA
## 13 2013     1   1     1306           1300         6     1622           1610        12      WN
## 14 2013     1   1     1356           1350         6     1659           1640        19      UA
## 15 2013     1   1     1430           1430         0     1735           1744        -9      UA
## 16 2013     1   1     1527           1515        12     1854           1810        44      UA
## 17 2013     1   1     1620           1620         0     1945           1922        23      UA
## 18 2013     1   1     1702           1700         2     2044           2028        16      UA
## 19 2013     1   1     1708           1700         8     2037           2005        32      WN
## 20 2013     1   1     1725           1720         5     2045           2021        24      UA
## 21 2013     1   1     1855           1848         7     2203           2200         3      UA
## 22 2013     1   1     1959           2000        -1     2310           2307         3      UA
## 23 2013     1   1     2030           2035        -5     2354           2342        12      B6
## 24 2013     1   1     2031           2030         1     2344           2335         9      UA
## 25 2013     1   2      512            515        -3      809            819       -10      UA
## 26 2013     1   2      536            529         7      840            828        12      UA
## 27 2013     1   2      625            629        -4      935            934         1      UA
## 28 2013     1   2      732            732         0     1047           1040         7      UA
## 29 2013     1   2      734            700        34     1045           1025        20      WN
## 30 2013     1   2      752            745         7     1055           1042        13      UA
## 31 2013     1   2      859            900        -1     1204           1220       -16      UA
## 32 2013     1   2      913            908         5     1252           1215        37      UA
## 33 2013     1   2     1027           1026         1     1328           1339       -11      UA
## 34 2013     1   2     1057           1045        12     1406           1351        15      UA
## 35 2013     1   2     1156           1158        -2     1517           1502        15      B6
## 36 2013     1   2     1200           1200         0     1513           1505         8      UA
## 37 2013     1   2     1251           1250         1     1552           1603       -11      UA
## 38 2013     1   2     1319           1305        14     1633           1615        18      WN
## 39 2013     1   2     1353           1350         3     1648           1640         8      UA
## 40 2013     1   2     1431           1430         1     1745           1744         1      UA
## 41 2013     1   2     1521           1515         6     1814           1810         4      UA
## 42 2013     1   2     1618           1620        -2     1931           1922         9      UA
## 43 2013     1   2     1708           1700         8     2035           2028         7      UA
## 44 2013     1   2     1729           1720         9     2040           2021        19      UA
## 45 2013     1   2     1810           1655        75     2146           2000       106      WN
## 46 2013     1   2     1915           1848        27     2225           2200        25      UA
## 47 2013     1   2     1950           1940        10     2236           2241        -5      UA
## 48 2013     1   2     2031           2035        -4     2353           2342        11      B6
## 49 2013     1   2     2101           2035        26        7           2340        27      UA
## 50 2013     1   3      520            525        -5      830            820        10      UA
## 51 2013     1   3      532            530         2      851            831        20      UA
## 52 2013     1   3      636            625        11      945            932        13      UA
##    flight tailnum origin dest air_time distance hour minute            time_hour
## 1    1545  N14228    EWR  IAH      227     1400    5     15 2013-01-01T10:00:00Z
## 2    1714  N24211    LGA  IAH      227     1416    5     29 2013-01-01T10:00:00Z
## 3     496  N459UA    LGA  IAH      229     1416    6     27 2013-01-01T11:00:00Z
## 4     473  N488UA    LGA  IAH      238     1416    7     32 2013-01-01T12:00:00Z
## 5    1479  N37408    EWR  IAH      249     1400    7     39 2013-01-01T12:00:00Z
## 6    1220  N12216    EWR  IAH      233     1400    9      8 2013-01-01T14:00:00Z
## 7    1004  N76508    LGA  IAH      237     1416   10     26 2013-01-01T15:00:00Z
## 8     455  N667UA    EWR  IAH      229     1400   10     45 2013-01-01T15:00:00Z
## 9    1086  N76502    LGA  IAH      248     1416    9      0 2013-01-01T14:00:00Z
## 10   1461  N39418    EWR  IAH      221     1400   12      0 2013-01-01T17:00:00Z
## 11    625  N239JB    JFK  HOU      253     1428   11     58 2013-01-01T16:00:00Z
## 12   1280  N26210    LGA  IAH      238     1416   12     50 2013-01-01T17:00:00Z
## 13   2596  N773SA    EWR  HOU      239     1411   13      0 2013-01-01T18:00:00Z
## 14   1258  N26906    EWR  IAH      218     1400   13     50 2013-01-01T18:00:00Z
## 15    997  N452UA    LGA  IAH      227     1416   14     30 2013-01-01T19:00:00Z
## 16   1695  N69059    EWR  IAH      210     1400   15     15 2013-01-01T20:00:00Z
## 17   1178  N18119    EWR  IAH      242     1400   16     20 2013-01-01T21:00:00Z
## 18   1259  N16632    LGA  IAH      234     1416   17      0 2013-01-01T22:00:00Z
## 19   1066  N778SW    EWR  HOU      245     1411   17      0 2013-01-01T22:00:00Z
## 20   1712  N17122    EWR  IAH      235     1400   17     20 2013-01-01T22:00:00Z
## 21   1128  N36207    LGA  IAH      231     1416   18     48 2013-01-01T23:00:00Z
## 22   1233  N76514    EWR  IAH      232     1400   20      0 2013-01-02T01:00:00Z
## 23    629  N192JB    JFK  HOU      245     1428   20     35 2013-01-02T01:00:00Z
## 24    834  N822UA    EWR  IAH      223     1400   20     30 2013-01-02T01:00:00Z
## 25   1453  N76515    EWR  IAH      214     1400    5     15 2013-01-02T10:00:00Z
## 26    407  N493UA    LGA  IAH      231     1416    5     29 2013-01-02T10:00:00Z
## 27    473  N461UA    LGA  IAH      230     1416    6     29 2013-01-02T11:00:00Z
## 28   1509  N73291    LGA  IAH      230     1416    7     32 2013-01-02T12:00:00Z
## 29     20  N485WN    EWR  HOU      235     1411    7      0 2013-01-02T12:00:00Z
## 30    251  N430UA    EWR  IAH      215     1400    7     45 2013-01-02T12:00:00Z
## 31    667  N843UA    LGA  IAH      230     1416    9      0 2013-01-02T14:00:00Z
## 32    493  N561UA    EWR  IAH      227     1400    9      8 2013-01-02T14:00:00Z
## 33   1563  N14704    LGA  IAH      219     1416   10     26 2013-01-02T15:00:00Z
## 34    491  N677UA    EWR  IAH      226     1400   10     45 2013-01-02T15:00:00Z
## 35    625  N192JB    JFK  HOU      241     1428   11     58 2013-01-02T16:00:00Z
## 36   1461  N27724    EWR  IAH      232     1400   12      0 2013-01-02T17:00:00Z
## 37    633  N514UA    LGA  IAH      225     1416   12     50 2013-01-02T17:00:00Z
## 38   3294  N950WN    EWR  HOU      240     1411   13      5 2013-01-02T18:00:00Z
## 39   1153  N45905    EWR  IAH      208     1400   13     50 2013-01-02T18:00:00Z
## 40    566  N847UA    LGA  IAH      237     1416   14     30 2013-01-02T19:00:00Z
## 41   1695  N76054    EWR  IAH      205     1400   15     15 2013-01-02T20:00:00Z
## 42   1178  N14115    EWR  IAH      220     1400   16     20 2013-01-02T21:00:00Z
## 43   1259  N24633    LGA  IAH      238     1416   17      0 2013-01-02T22:00:00Z
## 44   1125  N34131    EWR  IAH      226     1400   17     20 2013-01-02T22:00:00Z
## 45   2529  N901WN    EWR  HOU      243     1411   16     55 2013-01-02T21:00:00Z
## 46   1128  N73283    LGA  IAH      230     1416   18     48 2013-01-02T23:00:00Z
## 47   1221  N23708    EWR  IAH      209     1400   19     40 2013-01-03T00:00:00Z
## 48    629  N273JB    JFK  HOU      244     1428   20     35 2013-01-03T01:00:00Z
## 49    834  N454UA    EWR  IAH      223     1400   20     35 2013-01-03T01:00:00Z
## 50   1018  N78511    EWR  IAH      238     1400    5     25 2013-01-03T10:00:00Z
## 51   1136  N76522    LGA  IAH      241     1416    5     30 2013-01-03T10:00:00Z
## 52    468  N412UA    LGA  IAH      229     1416    6     25 2013-01-03T11:00:00Z
## [ reached 'max' / getOption("max.print") -- omitted 9261 rows ]## year month day dep_time sched_dep_time dep_delay arr_time sched_arr_time arr_delay carrier
## 1 2013 1 1 517 515 2 830 819 11 UA
## 2 2013 1 1 533 529 4 850 830 20 UA
## 3 2013 1 1 623 627 -4 933 932 1 UA
## 4 2013 1 1 728 732 -4 1041 1038 3 UA
## 5 2013 1 1 739 739 0 1104 1038 26 UA
## 6 2013 1 1 908 908 0 1228 1219 9 UA
## 7 2013 1 1 1028 1026 2 1350 1339 11 UA
## 8 2013 1 1 1044 1045 -1 1352 1351 1 UA
## 9 2013 1 1 1114 900 134 1447 1222 145 UA
## 10 2013 1 1 1205 1200 5 1503 1505 -2 UA
## 11 2013 1 1 1208 1158 10 1540 1502 38 B6
## 12 2013 1 1 1248 1250 -2 1607 1607 0 UA
## 13 2013 1 1 1306 1300 6 1622 1610 12 WN
## 14 2013 1 1 1356 1350 6 1659 1640 19 UA
## 15 2013 1 1 1430 1430 0 1735 1744 -9 UA
## 16 2013 1 1 1527 1515 12 1854 1810 44 UA
## 17 2013 1 1 1620 1620 0 1945 1922 23 UA
## 18 2013 1 1 1702 1700 2 2044 2028 16 UA
## 19 2013 1 1 1708 1700 8 2037 2005 32 WN
## 20 2013 1 1 1725 1720 5 2045 2021 24 UA
## 21 2013 1 1 1855 1848 7 2203 2200 3 UA
## 22 2013 1 1 1959 2000 -1 2310 2307 3 UA
## 23 2013 1 1 2030 2035 -5 2354 2342 12 B6
## 24 2013 1 1 2031 2030 1 2344 2335 9 UA
## 25 2013 1 2 512 515 -3 809 819 -10 UA
## 26 2013 1 2 536 529 7 840 828 12 UA
## 27 2013 1 2 625 629 -4 935 934 1 UA
## 28 2013 1 2 732 732 0 1047 1040 7 UA
## 29 2013 1 2 734 700 34 1045 1025 20 WN
## 30 2013 1 2 752 745 7 1055 1042 13 UA
## 31 2013 1 2 859 900 -1 1204 1220 -16 UA
## 32 2013 1 2 913 908 5 1252 1215 37 UA
## 33 2013 1 2 1027 1026 1 1328 1339 -11 UA
## 34 2013 1 2 1057 1045 12 1406 1351 15 UA
## 35 2013 1 2 1156 1158 -2 1517 1502 15 B6
## 36 2013 1 2 1200 1200 0 1513 1505 8 UA
## 37 2013 1 2 1251 1250 1 1552 1603 -11 UA
## 38 2013 1 2 1319 1305 14 1633 1615 18 WN
## 39 2013 1 2 1353 1350 3 1648 1640 8 UA
## 40 2013 1 2 1431 1430 1 1745 1744 1 UA
## 41 2013 1 2 1521 1515 6 1814 1810 4 UA
## 42 2013 1 2 1618 1620 -2 1931 1922 9 UA
## 43 2013 1 2 1708 1700 8 2035 2028 7 UA
## 44 2013 1 2 1729 1720 9 2040 2021 19 UA
## 45 2013 1 2 1810 1655 75 2146 2000 106 WN
## 46 2013 1 2 1915 1848 27 2225 2200 25 UA
## 47 2013 1 2 1950 1940 10 2236 2241 -5 UA
## 48 2013 1 2 2031 2035 -4 2353 2342 11 B6
## 49 2013 1 2 2101 2035 26 7 2340 27 UA
## 50 2013 1 3 520 525 -5 830 820 10 UA
## 51 2013 1 3 532 530 2 851 831 20 UA
## 52 2013 1 3 636 625 11 945 932 13 UA
## flight tailnum origin dest air_time distance hour minute time_hour
## 1 1545 N14228 EWR IAH 227 1400 5 15 2013-01-01T10:00:00Z
## 2 1714 N24211 LGA IAH 227 1416 5 29 2013-01-01T10:00:00Z
## 3 496 N459UA LGA IAH 229 1416 6 27 2013-01-01T11:00:00Z
## 4 473 N488UA LGA IAH 238 1416 7 32 2013-01-01T12:00:00Z
## 5 1479 N37408 EWR IAH 249 1400 7 39 2013-01-01T12:00:00Z
## 6 1220 N12216 EWR IAH 233 1400 9 8 2013-01-01T14:00:00Z
## 7 1004 N76508 LGA IAH 237 1416 10 26 2013-01-01T15:00:00Z
## 8 455 N667UA EWR IAH 229 1400 10 45 2013-01-01T15:00:00Z
## 9 1086 N76502 LGA IAH 248 1416 9 0 2013-01-01T14:00:00Z
## 10 1461 N39418 EWR IAH 221 1400 12 0 2013-01-01T17:00:00Z
## 11 625 N239JB JFK HOU 253 1428 11 58 2013-01-01T16:00:00Z
## 12 1280 N26210 LGA IAH 238 1416 12 50 2013-01-01T17:00:00Z
## 13 2596 N773SA EWR HOU 239 1411 13 0 2013-01-01T18:00:00Z
## 14 1258 N26906 EWR IAH 218 1400 13 50 2013-01-01T18:00:00Z
## 15 997 N452UA LGA IAH 227 1416 14 30 2013-01-01T19:00:00Z
## 16 1695 N69059 EWR IAH 210 1400 15 15 2013-01-01T20:00:00Z
## 17 1178 N18119 EWR IAH 242 1400 16 20 2013-01-01T21:00:00Z
## 18 1259 N16632 LGA IAH 234 1416 17 0 2013-01-01T22:00:00Z
## 19 1066 N778SW EWR HOU 245 1411 17 0 2013-01-01T22:00:00Z
## 20 1712 N17122 EWR IAH 235 1400 17 20 2013-01-01T22:00:00Z
## 21 1128 N36207 LGA IAH 231 1416 18 48 2013-01-01T23:00:00Z
## 22 1233 N76514 EWR IAH 232 1400 20 0 2013-01-02T01:00:00Z
## 23 629 N192JB JFK HOU 245 1428 20 35 2013-01-02T01:00:00Z
## 24 834 N822UA EWR IAH 223 1400 20 30 2013-01-02T01:00:00Z
## 25 1453 N76515 EWR IAH 214 1400 5 15 2013-01-02T10:00:00Z
## 26 407 N493UA LGA IAH 231 1416 5 29 2013-01-02T10:00:00Z
## 27 473 N461UA LGA IAH 230 1416 6 29 2013-01-02T11:00:00Z
## 28 1509 N73291 LGA IAH 230 1416 7 32 2013-01-02T12:00:00Z
## 29 20 N485WN EWR HOU 235 1411 7 0 2013-01-02T12:00:00Z
## 30 251 N430UA EWR IAH 215 1400 7 45 2013-01-02T12:00:00Z
## 31 667 N843UA LGA IAH 230 1416 9 0 2013-01-02T14:00:00Z
## 32 493 N561UA EWR IAH 227 1400 9 8 2013-01-02T14:00:00Z
## 33 1563 N14704 LGA IAH 219 1416 10 26 2013-01-02T15:00:00Z
## 34 491 N677UA EWR IAH 226 1400 10 45 2013-01-02T15:00:00Z
## 35 625 N192JB JFK HOU 241 1428 11 58 2013-01-02T16:00:00Z
## 36 1461 N27724 EWR IAH 232 1400 12 0 2013-01-02T17:00:00Z
## 37 633 N514UA LGA IAH 225 1416 12 50 2013-01-02T17:00:00Z
## 38 3294 N950WN EWR HOU 240 1411 13 5 2013-01-02T18:00:00Z
## 39 1153 N45905 EWR IAH 208 1400 13 50 2013-01-02T18:00:00Z
## 40 566 N847UA LGA IAH 237 1416 14 30 2013-01-02T19:00:00Z
## 41 1695 N76054 EWR IAH 205 1400 15 15 2013-01-02T20:00:00Z
## 42 1178 N14115 EWR IAH 220 1400 16 20 2013-01-02T21:00:00Z
## 43 1259 N24633 LGA IAH 238 1416 17 0 2013-01-02T22:00:00Z
## 44 1125 N34131 EWR IAH 226 1400 17 20 2013-01-02T22:00:00Z
## 45 2529 N901WN EWR HOU 243 1411 16 55 2013-01-02T21:00:00Z
## 46 1128 N73283 LGA IAH 230 1416 18 48 2013-01-02T23:00:00Z
## 47 1221 N23708 EWR IAH 209 1400 19 40 2013-01-03T00:00:00Z
## 48 629 N273JB JFK HOU 244 1428 20 35 2013-01-03T01:00:00Z
## 49 834 N454UA EWR IAH 223 1400 20 35 2013-01-03T01:00:00Z
## 50 1018 N78511 EWR IAH 238 1400 5 25 2013-01-03T10:00:00Z
## 51 1136 N76522 LGA IAH 241 1416 5 30 2013-01-03T10:00:00Z
## 52 468 N412UA LGA IAH 229 1416 6 25 2013-01-03T11:00:00Z
## [ reached 'max' / getOption("max.print") -- omitted 9261 rows ]Solution c
c. Were operated by United, American, or Delta
This one takes a bit of effort–you have to find the codes that match the values in the variable carrier with the airline names.
In addition to the flights table, the {nycflights13} package has a number of other tables, including airlines
nycflights13::airlines## # A tibble: 16 × 2
## carrier name
## <chr> <chr>
## 1 9E Endeavor Air Inc.
## 2 AA American Airlines Inc.
## 3 AS Alaska Airlines Inc.
## 4 B6 JetBlue Airways
## 5 DL Delta Air Lines Inc.
## 6 EV ExpressJet Airlines Inc.
## 7 F9 Frontier Airlines Inc.
## 8 FL AirTran Airways Corporation
## 9 HA Hawaiian Airlines Inc.
## 10 MQ Envoy Air
## 11 OO SkyWest Airlines Inc.
## 12 UA United Air Lines Inc.
## 13 US US Airways Inc.
## 14 VX Virgin America
## 15 WN Southwest Airlines Co.
## 16 YV Mesa Airlines Inc.From this, we can find:
United == UA
American == AA
Delta == DL
# the `%in%` approach -- other methods are possible!
filter(flights, carrier %in% c("AA", "DL", "UA"))
## year month day dep_time sched_dep_time dep_delay arr_time sched_arr_time arr_delay carrier
## 1 2013 1 1 517 515 2 830 819 11 UA
## 2 2013 1 1 533 529 4 850 830 20 UA
## 3 2013 1 1 542 540 2 923 850 33 AA
## 4 2013 1 1 554 600 -6 812 837 -25 DL
## 5 2013 1 1 554 558 -4 740 728 12 UA
## 6 2013 1 1 558 600 -2 753 745 8 AA
## 7 2013 1 1 558 600 -2 924 917 7 UA
## 8 2013 1 1 558 600 -2 923 937 -14 UA
## 9 2013 1 1 559 600 -1 941 910 31 AA
## 10 2013 1 1 559 600 -1 854 902 -8 UA
## 11 2013 1 1 602 610 -8 812 820 -8 DL
## 12 2013 1 1 606 610 -4 858 910 -12 AA
## 13 2013 1 1 606 610 -4 837 845 -8 DL
## 14 2013 1 1 607 607 0 858 915 -17 UA
## 15 2013 1 1 611 600 11 945 931 14 UA
## 16 2013 1 1 615 615 0 833 842 -9 DL
## 17 2013 1 1 623 610 13 920 915 5 AA
## 18 2013 1 1 623 627 -4 933 932 1 UA
## 19 2013 1 1 628 630 -2 1137 1140 -3 AA
## 20 2013 1 1 628 630 -2 1016 947 29 UA
## 21 2013 1 1 629 630 -1 824 810 14 AA
## 22 2013 1 1 635 635 0 1028 940 48 AA
## 23 2013 1 1 643 646 -3 922 940 -18 UA
## 24 2013 1 1 644 636 8 931 940 -9 UA
## 25 2013 1 1 646 645 1 910 916 -6 UA
## 26 2013 1 1 646 645 1 1023 1030 -7 UA
## 27 2013 1 1 653 700 -7 936 1009 -33 DL
## 28 2013 1 1 655 655 0 1021 1030 -9 DL
## 29 2013 1 1 655 700 -5 1037 1045 -8 DL
## 30 2013 1 1 655 700 -5 1002 1020 -18 DL
## 31 2013 1 1 656 700 -4 854 850 4 AA
## 32 2013 1 1 656 659 -3 949 959 -10 AA
## 33 2013 1 1 656 700 -4 948 1011 -23 UA
## 34 2013 1 1 657 700 -3 959 1013 -14 DL
## 35 2013 1 1 658 700 -2 944 939 5 DL
## 36 2013 1 1 659 700 -1 1008 1015 -7 AA
## 37 2013 1 1 659 705 -6 907 913 -6 DL
## 38 2013 1 1 659 700 -1 959 1008 -9 UA
## 39 2013 1 1 701 700 1 1123 1154 -31 UA
## 40 2013 1 1 709 700 9 852 832 20 UA
## 41 2013 1 1 712 715 -3 1023 1035 -12 AA
## 42 2013 1 1 715 713 2 911 850 21 UA
## 43 2013 1 1 723 725 -2 1013 1017 -4 UA
## 44 2013 1 1 724 730 -6 1111 1040 31 AA
## 45 2013 1 1 725 730 -5 1052 1040 12 AA
## 46 2013 1 1 727 730 -3 959 952 7 UA
## 47 2013 1 1 728 732 -4 1041 1038 3 UA
## 48 2013 1 1 732 645 47 1011 941 30 UA
## 49 2013 1 1 739 745 -6 918 930 -12 AA
## 50 2013 1 1 739 739 0 1104 1038 26 UA
## 51 2013 1 1 743 730 13 1107 1100 7 AA
## 52 2013 1 1 743 730 13 1059 1056 3 DL
## flight tailnum origin dest air_time distance hour minute time_hour
## 1 1545 N14228 EWR IAH 227 1400 5 15 2013-01-01T10:00:00Z
## 2 1714 N24211 LGA IAH 227 1416 5 29 2013-01-01T10:00:00Z
## 3 1141 N619AA JFK MIA 160 1089 5 40 2013-01-01T10:00:00Z
## 4 461 N668DN LGA ATL 116 762 6 0 2013-01-01T11:00:00Z
## 5 1696 N39463 EWR ORD 150 719 5 58 2013-01-01T10:00:00Z
## 6 301 N3ALAA LGA ORD 138 733 6 0 2013-01-01T11:00:00Z
## 7 194 N29129 JFK LAX 345 2475 6 0 2013-01-01T11:00:00Z
## 8 1124 N53441 EWR SFO 361 2565 6 0 2013-01-01T11:00:00Z
## 9 707 N3DUAA LGA DFW 257 1389 6 0 2013-01-01T11:00:00Z
## 10 1187 N76515 EWR LAS 337 2227 6 0 2013-01-01T11:00:00Z
## 11 1919 N971DL LGA MSP 170 1020 6 10 2013-01-01T11:00:00Z
## 12 1895 N633AA EWR MIA 152 1085 6 10 2013-01-01T11:00:00Z
## 13 1743 N3739P JFK ATL 128 760 6 10 2013-01-01T11:00:00Z
## 14 1077 N53442 EWR MIA 157 1085 6 7 2013-01-01T11:00:00Z
## 15 303 N532UA JFK SFO 366 2586 6 0 2013-01-01T11:00:00Z
## 16 575 N326NB EWR ATL 120 746 6 15 2013-01-01T11:00:00Z
## 17 1837 N3EMAA LGA MIA 153 1096 6 10 2013-01-01T11:00:00Z
## 18 496 N459UA LGA IAH 229 1416 6 27 2013-01-01T11:00:00Z
## 19 413 N3BAAA JFK SJU 192 1598 6 30 2013-01-01T11:00:00Z
## 20 1665 N33289 EWR LAX 366 2454 6 30 2013-01-01T11:00:00Z
## 21 303 N3CYAA LGA ORD 140 733 6 30 2013-01-01T11:00:00Z
## 22 711 N3GKAA LGA DFW 248 1389 6 35 2013-01-01T11:00:00Z
## 23 556 N497UA EWR PBI 146 1023 6 46 2013-01-01T11:00:00Z
## 24 1701 N75435 EWR FLL 151 1065 6 36 2013-01-01T11:00:00Z
## 25 883 N569UA LGA DEN 243 1620 6 45 2013-01-01T11:00:00Z
## 26 1496 N38727 EWR SNA 380 2434 6 45 2013-01-01T11:00:00Z
## 27 1383 N327NW LGA PBI 149 1035 7 0 2013-01-01T12:00:00Z
## 28 1415 N3763D JFK SLC 294 1990 6 55 2013-01-01T11:00:00Z
## 29 1865 N705TW JFK SFO 362 2586 7 0 2013-01-01T12:00:00Z
## 30 2003 N997DL LGA MIA 161 1096 7 0 2013-01-01T12:00:00Z
## 31 305 N4WNAA LGA ORD 143 733 7 0 2013-01-01T12:00:00Z
## 32 1815 N5FMAA JFK MCO 142 944 6 59 2013-01-01T11:00:00Z
## 33 1115 N24212 EWR TPA 156 997 7 0 2013-01-01T12:00:00Z
## 34 1879 N318NB LGA FLL 164 1076 7 0 2013-01-01T12:00:00Z
## 35 1547 N6703D LGA ATL 126 762 7 0 2013-01-01T12:00:00Z
## 36 2279 N3EKAA LGA MIA 159 1096 7 0 2013-01-01T12:00:00Z
## 37 831 N998DL LGA DTW 105 502 7 5 2013-01-01T12:00:00Z
## 38 960 N838UA EWR RSW 164 1068 7 0 2013-01-01T12:00:00Z
## 39 1203 N77296 EWR SJU 188 1608 7 0 2013-01-01T12:00:00Z
## 40 1092 N26226 LGA ORD 135 733 7 0 2013-01-01T12:00:00Z
## 41 825 N3ETAA JFK FLL 159 1069 7 15 2013-01-01T12:00:00Z
## 42 544 N841UA EWR ORD 156 719 7 13 2013-01-01T12:00:00Z
## 43 962 N514UA EWR PBI 153 1023 7 25 2013-01-01T12:00:00Z
## 44 715 N541AA LGA DFW 254 1389 7 30 2013-01-01T12:00:00Z
## 45 2083 N4WRAA EWR DFW 238 1372 7 30 2013-01-01T12:00:00Z
## 46 1162 N37462 EWR DEN 254 1605 7 30 2013-01-01T12:00:00Z
## 47 473 N488UA LGA IAH 238 1416 7 32 2013-01-01T12:00:00Z
## 48 1111 N37456 EWR MCO 145 937 6 45 2013-01-01T11:00:00Z
## 49 309 N4WPAA LGA ORD 137 733 7 45 2013-01-01T12:00:00Z
## 50 1479 N37408 EWR IAH 249 1400 7 39 2013-01-01T12:00:00Z
## 51 33 N338AA JFK LAX 358 2475 7 30 2013-01-01T12:00:00Z
## 52 495 N3760C JFK SEA 349 2422 7 30 2013-01-01T12:00:00Z
## [ reached 'max' / getOption("max.print") -- omitted 139452 rows ]Solution d
- Departed in summer (July, August, and September)
The variable month is numeric, so we have to use greater than and less than to define the range.
filter(flights, month >= 7, month <= 9)## year month day dep_time sched_dep_time dep_delay arr_time sched_arr_time arr_delay carrier
## 1 2013 7 1 1 2029 212 236 2359 157 B6
## 2 2013 7 1 2 2359 3 344 344 0 B6
## 3 2013 7 1 29 2245 104 151 1 110 B6
## 4 2013 7 1 43 2130 193 322 14 188 B6
## 5 2013 7 1 44 2150 174 300 100 120 AA
## 6 2013 7 1 46 2051 235 304 2358 186 B6
## 7 2013 7 1 48 2001 287 308 2305 243 VX
## 8 2013 7 1 58 2155 183 335 43 172 B6
## 9 2013 7 1 100 2146 194 327 30 177 B6
## 10 2013 7 1 100 2245 135 337 135 122 B6
## 11 2013 7 1 107 2245 142 158 2359 119 B6
## 12 2013 7 1 111 2359 72 448 340 68 B6
## 13 2013 7 1 114 2135 219 310 8 182 B6
## 14 2013 7 1 459 500 -1 642 640 2 US
## 15 2013 7 1 538 540 -2 800 810 -10 UA
## 16 2013 7 1 540 540 0 841 840 1 AA
## 17 2013 7 1 543 545 -2 932 921 11 B6
## 18 2013 7 1 547 548 -1 903 851 12 UA
## 19 2013 7 1 548 545 3 815 819 -4 UA
## 20 2013 7 1 549 600 -11 645 655 -10 US
## 21 2013 7 1 551 600 -9 721 700 21 US
## 22 2013 7 1 554 600 -6 707 659 8 US
## 23 2013 7 1 556 600 -4 820 825 -5 DL
## 24 2013 7 1 557 600 -3 817 802 15 EV
## 25 2013 7 1 557 600 -3 727 730 -3 EV
## 26 2013 7 1 557 600 -3 719 716 3 EV
## 27 2013 7 1 557 600 -3 712 725 -13 AA
## 28 2013 7 1 557 605 -8 838 820 18 MQ
## 29 2013 7 1 557 600 -3 828 907 -39 UA
## 30 2013 7 1 559 605 -6 748 735 13 MQ
## 31 2013 7 1 600 600 0 836 830 6 AA
## 32 2013 7 1 600 600 0 839 834 5 B6
## 33 2013 7 1 600 600 0 848 840 8 WN
## 34 2013 7 1 600 559 1 700 720 -20 UA
## 35 2013 7 1 601 600 1 753 724 29 UA
## 36 2013 7 1 602 605 -3 752 745 7 DL
## 37 2013 7 1 603 608 -5 713 719 -6 B6
## 38 2013 7 1 604 605 -1 909 905 4 AA
## 39 2013 7 1 605 609 -4 901 859 2 B6
## 40 2013 7 1 605 600 5 717 727 -10 UA
## 41 2013 7 1 606 605 1 925 909 16 UA
## 42 2013 7 1 606 610 -4 847 924 -37 UA
## 43 2013 7 1 607 611 -4 948 954 -6 B6
## 44 2013 7 1 607 610 -3 823 807 16 DL
## 45 2013 7 1 609 600 9 902 851 11 B6
## 46 2013 7 1 610 605 5 713 720 -7 WN
## 47 2013 7 1 611 620 -9 820 817 3 EV
## 48 2013 7 1 611 610 1 723 725 -2 WN
## 49 2013 7 1 611 615 -4 842 857 -15 UA
## 50 2013 7 1 614 600 14 732 715 17 MQ
## 51 2013 7 1 615 615 0 923 910 13 AA
## 52 2013 7 1 615 615 0 809 808 1 US
## flight tailnum origin dest air_time distance hour minute time_hour
## 1 915 N653JB JFK SFO 315 2586 20 29 2013-07-02T00:00:00Z
## 2 1503 N805JB JFK SJU 200 1598 23 59 2013-07-02T03:00:00Z
## 3 234 N348JB JFK BTV 66 266 22 45 2013-07-02T02:00:00Z
## 4 1371 N794JB LGA FLL 143 1076 21 30 2013-07-02T01:00:00Z
## 5 185 N324AA JFK LAX 297 2475 21 50 2013-07-02T01:00:00Z
## 6 165 N640JB JFK PDX 304 2454 20 51 2013-07-02T00:00:00Z
## 7 415 N627VA JFK LAX 298 2475 20 1 2013-07-02T00:00:00Z
## 8 425 N535JB JFK TPA 140 1005 21 55 2013-07-02T01:00:00Z
## 9 1183 N531JB JFK MCO 126 944 21 46 2013-07-02T01:00:00Z
## 10 623 N663JB JFK LAX 304 2475 22 45 2013-07-02T02:00:00Z
## 11 1816 N249JB JFK SYR 39 209 22 45 2013-07-02T02:00:00Z
## 12 839 N608JB JFK BQN 199 1576 23 59 2013-07-02T03:00:00Z
## 13 611 N584JB JFK LAS 276 2248 21 35 2013-07-02T01:00:00Z
## 14 1431 N167US EWR CLT 87 529 5 0 2013-07-01T09:00:00Z
## 15 332 N442UA EWR IAH 185 1400 5 40 2013-07-01T09:00:00Z
## 16 701 N5ENAA JFK MIA 155 1089 5 40 2013-07-01T09:00:00Z
## 17 939 N708JB JFK BQN 198 1576 5 45 2013-07-01T09:00:00Z
## 18 651 N545UA EWR SFO 343 2565 5 48 2013-07-01T09:00:00Z
## 19 1714 N14237 LGA IAH 188 1416 5 45 2013-07-01T09:00:00Z
## 20 1629 N959UW LGA PHL 37 96 6 0 2013-07-01T10:00:00Z
## 21 2114 N751UW LGA BOS 38 184 6 0 2013-07-01T10:00:00Z
## 22 2161 N752US LGA DCA 45 214 6 0 2013-07-01T10:00:00Z
## 23 461 N915DL LGA ATL 119 762 6 0 2013-07-01T10:00:00Z
## 24 4372 N21129 EWR MSP 154 1008 6 0 2013-07-01T10:00:00Z
## 25 4424 N18101 EWR RDU 69 416 6 0 2013-07-01T10:00:00Z
## 26 6177 N13908 EWR IAD 47 212 6 0 2013-07-01T10:00:00Z
## 27 301 N496AA LGA ORD 110 733 6 0 2013-07-01T10:00:00Z
## 28 3550 N521MQ LGA ATL 123 762 6 5 2013-07-01T10:00:00Z
## 29 1209 N11206 EWR LAX 300 2454 6 0 2013-07-01T10:00:00Z
## 30 3525 N721MQ LGA RDU 72 431 6 5 2013-07-01T10:00:00Z
## 31 707 N3DBAA LGA DFW 186 1389 6 0 2013-07-01T10:00:00Z
## 32 27 N559JB EWR MCO 136 937 6 0 2013-07-01T10:00:00Z
## 33 488 N253WN EWR HOU 201 1411 6 0 2013-07-01T10:00:00Z
## 34 597 N428UA EWR BOS 40 200 5 59 2013-07-01T09:00:00Z
## 35 350 N487UA LGA ORD 126 733 6 0 2013-07-01T10:00:00Z
## 36 1279 N363NB LGA MEM 140 963 6 5 2013-07-01T10:00:00Z
## 37 2180 N304JB EWR BOS 44 200 6 8 2013-07-01T10:00:00Z
## 38 1837 N3EYAA LGA MIA 159 1096 6 5 2013-07-01T10:00:00Z
## 39 601 N613JB JFK FLL 151 1069 6 9 2013-07-01T10:00:00Z
## 40 569 N498UA EWR ORD 109 719 6 0 2013-07-01T10:00:00Z
## 41 774 N811UA EWR RSW 154 1068 6 5 2013-07-01T10:00:00Z
## 42 303 N555UA JFK SFO 324 2586 6 10 2013-07-01T10:00:00Z
## 43 1403 N634JB JFK SJU 199 1598 6 11 2013-07-01T10:00:00Z
## 44 1919 N356NW LGA MSP 145 1020 6 10 2013-07-01T10:00:00Z
## 45 371 N584JB LGA FLL 150 1076 6 0 2013-07-01T10:00:00Z
## 46 3574 N556WN EWR MDW 103 711 6 5 2013-07-01T10:00:00Z
## 47 4963 N186PQ EWR MSP 150 1008 6 20 2013-07-01T10:00:00Z
## 48 273 N8317M LGA MDW 107 725 6 10 2013-07-01T10:00:00Z
## 49 1144 N87513 EWR MCO 130 937 6 15 2013-07-01T10:00:00Z
## 50 3267 N505MQ EWR ORD 106 719 6 0 2013-07-01T10:00:00Z
## 51 1895 N3HJAA EWR MIA 158 1085 6 15 2013-07-01T10:00:00Z
## 52 1447 N103US JFK CLT 87 541 6 15 2013-07-01T10:00:00Z
## [ reached 'max' / getOption("max.print") -- omitted 86274 rows ]Using the : operator would also allow us to make a range.
##    year month day dep_time sched_dep_time dep_delay arr_time sched_arr_time arr_delay carrier
## 1  2013     7   1        1           2029       212      236           2359       157      B6
## 2  2013     7   1        2           2359         3      344            344         0      B6
## 3  2013     7   1       29           2245       104      151              1       110      B6
## 4  2013     7   1       43           2130       193      322             14       188      B6
## 5  2013     7   1       44           2150       174      300            100       120      AA
## 6  2013     7   1       46           2051       235      304           2358       186      B6
## 7  2013     7   1       48           2001       287      308           2305       243      VX
## 8  2013     7   1       58           2155       183      335             43       172      B6
## 9  2013     7   1      100           2146       194      327             30       177      B6
## 10 2013     7   1      100           2245       135      337            135       122      B6
## 11 2013     7   1      107           2245       142      158           2359       119      B6
## 12 2013     7   1      111           2359        72      448            340        68      B6
## 13 2013     7   1      114           2135       219      310              8       182      B6
## 14 2013     7   1      459            500        -1      642            640         2      US
## 15 2013     7   1      538            540        -2      800            810       -10      UA
## 16 2013     7   1      540            540         0      841            840         1      AA
## 17 2013     7   1      543            545        -2      932            921        11      B6
## 18 2013     7   1      547            548        -1      903            851        12      UA
## 19 2013     7   1      548            545         3      815            819        -4      UA
## 20 2013     7   1      549            600       -11      645            655       -10      US
## 21 2013     7   1      551            600        -9      721            700        21      US
## 22 2013     7   1      554            600        -6      707            659         8      US
## 23 2013     7   1      556            600        -4      820            825        -5      DL
## 24 2013     7   1      557            600        -3      817            802        15      EV
## 25 2013     7   1      557            600        -3      727            730        -3      EV
## 26 2013     7   1      557            600        -3      719            716         3      EV
## 27 2013     7   1      557            600        -3      712            725       -13      AA
## 28 2013     7   1      557            605        -8      838            820        18      MQ
## 29 2013     7   1      557            600        -3      828            907       -39      UA
## 30 2013     7   1      559            605        -6      748            735        13      MQ
## 31 2013     7   1      600            600         0      836            830         6      AA
## 32 2013     7   1      600            600         0      839            834         5      B6
## 33 2013     7   1      600            600         0      848            840         8      WN
## 34 2013     7   1      600            559         1      700            720       -20      UA
## 35 2013     7   1      601            600         1      753            724        29      UA
## 36 2013     7   1      602            605        -3      752            745         7      DL
## 37 2013     7   1      603            608        -5      713            719        -6      B6
## 38 2013     7   1      604            605        -1      909            905         4      AA
## 39 2013     7   1      605            609        -4      901            859         2      B6
## 40 2013     7   1      605            600         5      717            727       -10      UA
## 41 2013     7   1      606            605         1      925            909        16      UA
## 42 2013     7   1      606            610        -4      847            924       -37      UA
## 43 2013     7   1      607            611        -4      948            954        -6      B6
## 44 2013     7   1      607            610        -3      823            807        16      DL
## 45 2013     7   1      609            600         9      902            851        11      B6
## 46 2013     7   1      610            605         5      713            720        -7      WN
## 47 2013     7   1      611            620        -9      820            817         3      EV
## 48 2013     7   1      611            610         1      723            725        -2      WN
## 49 2013     7   1      611            615        -4      842            857       -15      UA
## 50 2013     7   1      614            600        14      732            715        17      MQ
## 51 2013     7   1      615            615         0      923            910        13      AA
## 52 2013     7   1      615            615         0      809            808         1      US
##    flight tailnum origin dest air_time distance hour minute            time_hour
## 1     915  N653JB    JFK  SFO      315     2586   20     29 2013-07-02T00:00:00Z
## 2    1503  N805JB    JFK  SJU      200     1598   23     59 2013-07-02T03:00:00Z
## 3     234  N348JB    JFK  BTV       66      266   22     45 2013-07-02T02:00:00Z
## 4    1371  N794JB    LGA  FLL      143     1076   21     30 2013-07-02T01:00:00Z
## 5     185  N324AA    JFK  LAX      297     2475   21     50 2013-07-02T01:00:00Z
## 6     165  N640JB    JFK  PDX      304     2454   20     51 2013-07-02T00:00:00Z
## 7     415  N627VA    JFK  LAX      298     2475   20      1 2013-07-02T00:00:00Z
## 8     425  N535JB    JFK  TPA      140     1005   21     55 2013-07-02T01:00:00Z
## 9    1183  N531JB    JFK  MCO      126      944   21     46 2013-07-02T01:00:00Z
## 10    623  N663JB    JFK  LAX      304     2475   22     45 2013-07-02T02:00:00Z
## 11   1816  N249JB    JFK  SYR       39      209   22     45 2013-07-02T02:00:00Z
## 12    839  N608JB    JFK  BQN      199     1576   23     59 2013-07-02T03:00:00Z
## 13    611  N584JB    JFK  LAS      276     2248   21     35 2013-07-02T01:00:00Z
## 14   1431  N167US    EWR  CLT       87      529    5      0 2013-07-01T09:00:00Z
## 15    332  N442UA    EWR  IAH      185     1400    5     40 2013-07-01T09:00:00Z
## 16    701  N5ENAA    JFK  MIA      155     1089    5     40 2013-07-01T09:00:00Z
## 17    939  N708JB    JFK  BQN      198     1576    5     45 2013-07-01T09:00:00Z
## 18    651  N545UA    EWR  SFO      343     2565    5     48 2013-07-01T09:00:00Z
## 19   1714  N14237    LGA  IAH      188     1416    5     45 2013-07-01T09:00:00Z
## 20   1629  N959UW    LGA  PHL       37       96    6      0 2013-07-01T10:00:00Z
## 21   2114  N751UW    LGA  BOS       38      184    6      0 2013-07-01T10:00:00Z
## 22   2161  N752US    LGA  DCA       45      214    6      0 2013-07-01T10:00:00Z
## 23    461  N915DL    LGA  ATL      119      762    6      0 2013-07-01T10:00:00Z
## 24   4372  N21129    EWR  MSP      154     1008    6      0 2013-07-01T10:00:00Z
## 25   4424  N18101    EWR  RDU       69      416    6      0 2013-07-01T10:00:00Z
## 26   6177  N13908    EWR  IAD       47      212    6      0 2013-07-01T10:00:00Z
## 27    301  N496AA    LGA  ORD      110      733    6      0 2013-07-01T10:00:00Z
## 28   3550  N521MQ    LGA  ATL      123      762    6      5 2013-07-01T10:00:00Z
## 29   1209  N11206    EWR  LAX      300     2454    6      0 2013-07-01T10:00:00Z
## 30   3525  N721MQ    LGA  RDU       72      431    6      5 2013-07-01T10:00:00Z
## 31    707  N3DBAA    LGA  DFW      186     1389    6      0 2013-07-01T10:00:00Z
## 32     27  N559JB    EWR  MCO      136      937    6      0 2013-07-01T10:00:00Z
## 33    488  N253WN    EWR  HOU      201     1411    6      0 2013-07-01T10:00:00Z
## 34    597  N428UA    EWR  BOS       40      200    5     59 2013-07-01T09:00:00Z
## 35    350  N487UA    LGA  ORD      126      733    6      0 2013-07-01T10:00:00Z
## 36   1279  N363NB    LGA  MEM      140      963    6      5 2013-07-01T10:00:00Z
## 37   2180  N304JB    EWR  BOS       44      200    6      8 2013-07-01T10:00:00Z
## 38   1837  N3EYAA    LGA  MIA      159     1096    6      5 2013-07-01T10:00:00Z
## 39    601  N613JB    JFK  FLL      151     1069    6      9 2013-07-01T10:00:00Z
## 40    569  N498UA    EWR  ORD      109      719    6      0 2013-07-01T10:00:00Z
## 41    774  N811UA    EWR  RSW      154     1068    6      5 2013-07-01T10:00:00Z
## 42    303  N555UA    JFK  SFO      324     2586    6     10 2013-07-01T10:00:00Z
## 43   1403  N634JB    JFK  SJU      199     1598    6     11 2013-07-01T10:00:00Z
## 44   1919  N356NW    LGA  MSP      145     1020    6     10 2013-07-01T10:00:00Z
## 45    371  N584JB    LGA  FLL      150     1076    6      0 2013-07-01T10:00:00Z
## 46   3574  N556WN    EWR  MDW      103      711    6      5 2013-07-01T10:00:00Z
## 47   4963  N186PQ    EWR  MSP      150     1008    6     20 2013-07-01T10:00:00Z
## 48    273  N8317M    LGA  MDW      107      725    6     10 2013-07-01T10:00:00Z
## 49   1144  N87513    EWR  MCO      130      937    6     15 2013-07-01T10:00:00Z
## 50   3267  N505MQ    EWR  ORD      106      719    6      0 2013-07-01T10:00:00Z
## 51   1895  N3HJAA    EWR  MIA      158     1085    6     15 2013-07-01T10:00:00Z
## 52   1447  N103US    JFK  CLT       87      541    6     15 2013-07-01T10:00:00Z
## [ reached 'max' / getOption("max.print") -- omitted 86274 rows ]You could also use “or” |, or between()
filter(flights, month == 7 |
         month == 8 |
         month == 9)
## year month day dep_time sched_dep_time dep_delay arr_time sched_arr_time arr_delay carrier
## 1 2013 7 1 1 2029 212 236 2359 157 B6
## 2 2013 7 1 2 2359 3 344 344 0 B6
## 3 2013 7 1 29 2245 104 151 1 110 B6
## 4 2013 7 1 43 2130 193 322 14 188 B6
## 5 2013 7 1 44 2150 174 300 100 120 AA
## 6 2013 7 1 46 2051 235 304 2358 186 B6
## 7 2013 7 1 48 2001 287 308 2305 243 VX
## 8 2013 7 1 58 2155 183 335 43 172 B6
## 9 2013 7 1 100 2146 194 327 30 177 B6
## 10 2013 7 1 100 2245 135 337 135 122 B6
## 11 2013 7 1 107 2245 142 158 2359 119 B6
## 12 2013 7 1 111 2359 72 448 340 68 B6
## 13 2013 7 1 114 2135 219 310 8 182 B6
## 14 2013 7 1 459 500 -1 642 640 2 US
## 15 2013 7 1 538 540 -2 800 810 -10 UA
## 16 2013 7 1 540 540 0 841 840 1 AA
## 17 2013 7 1 543 545 -2 932 921 11 B6
## 18 2013 7 1 547 548 -1 903 851 12 UA
## 19 2013 7 1 548 545 3 815 819 -4 UA
## 20 2013 7 1 549 600 -11 645 655 -10 US
## 21 2013 7 1 551 600 -9 721 700 21 US
## 22 2013 7 1 554 600 -6 707 659 8 US
## 23 2013 7 1 556 600 -4 820 825 -5 DL
## 24 2013 7 1 557 600 -3 817 802 15 EV
## 25 2013 7 1 557 600 -3 727 730 -3 EV
## 26 2013 7 1 557 600 -3 719 716 3 EV
## 27 2013 7 1 557 600 -3 712 725 -13 AA
## 28 2013 7 1 557 605 -8 838 820 18 MQ
## 29 2013 7 1 557 600 -3 828 907 -39 UA
## 30 2013 7 1 559 605 -6 748 735 13 MQ
## 31 2013 7 1 600 600 0 836 830 6 AA
## 32 2013 7 1 600 600 0 839 834 5 B6
## 33 2013 7 1 600 600 0 848 840 8 WN
## 34 2013 7 1 600 559 1 700 720 -20 UA
## 35 2013 7 1 601 600 1 753 724 29 UA
## 36 2013 7 1 602 605 -3 752 745 7 DL
## 37 2013 7 1 603 608 -5 713 719 -6 B6
## 38 2013 7 1 604 605 -1 909 905 4 AA
## 39 2013 7 1 605 609 -4 901 859 2 B6
## 40 2013 7 1 605 600 5 717 727 -10 UA
## 41 2013 7 1 606 605 1 925 909 16 UA
## 42 2013 7 1 606 610 -4 847 924 -37 UA
## 43 2013 7 1 607 611 -4 948 954 -6 B6
## 44 2013 7 1 607 610 -3 823 807 16 DL
## 45 2013 7 1 609 600 9 902 851 11 B6
## 46 2013 7 1 610 605 5 713 720 -7 WN
## 47 2013 7 1 611 620 -9 820 817 3 EV
## 48 2013 7 1 611 610 1 723 725 -2 WN
## 49 2013 7 1 611 615 -4 842 857 -15 UA
## 50 2013 7 1 614 600 14 732 715 17 MQ
## 51 2013 7 1 615 615 0 923 910 13 AA
## 52 2013 7 1 615 615 0 809 808 1 US
## flight tailnum origin dest air_time distance hour minute time_hour
## 1 915 N653JB JFK SFO 315 2586 20 29 2013-07-02T00:00:00Z
## 2 1503 N805JB JFK SJU 200 1598 23 59 2013-07-02T03:00:00Z
## 3 234 N348JB JFK BTV 66 266 22 45 2013-07-02T02:00:00Z
## 4 1371 N794JB LGA FLL 143 1076 21 30 2013-07-02T01:00:00Z
## 5 185 N324AA JFK LAX 297 2475 21 50 2013-07-02T01:00:00Z
## 6 165 N640JB JFK PDX 304 2454 20 51 2013-07-02T00:00:00Z
## 7 415 N627VA JFK LAX 298 2475 20 1 2013-07-02T00:00:00Z
## 8 425 N535JB JFK TPA 140 1005 21 55 2013-07-02T01:00:00Z
## 9 1183 N531JB JFK MCO 126 944 21 46 2013-07-02T01:00:00Z
## 10 623 N663JB JFK LAX 304 2475 22 45 2013-07-02T02:00:00Z
## 11 1816 N249JB JFK SYR 39 209 22 45 2013-07-02T02:00:00Z
## 12 839 N608JB JFK BQN 199 1576 23 59 2013-07-02T03:00:00Z
## 13 611 N584JB JFK LAS 276 2248 21 35 2013-07-02T01:00:00Z
## 14 1431 N167US EWR CLT 87 529 5 0 2013-07-01T09:00:00Z
## 15 332 N442UA EWR IAH 185 1400 5 40 2013-07-01T09:00:00Z
## 16 701 N5ENAA JFK MIA 155 1089 5 40 2013-07-01T09:00:00Z
## 17 939 N708JB JFK BQN 198 1576 5 45 2013-07-01T09:00:00Z
## 18 651 N545UA EWR SFO 343 2565 5 48 2013-07-01T09:00:00Z
## 19 1714 N14237 LGA IAH 188 1416 5 45 2013-07-01T09:00:00Z
## 20 1629 N959UW LGA PHL 37 96 6 0 2013-07-01T10:00:00Z
## 21 2114 N751UW LGA BOS 38 184 6 0 2013-07-01T10:00:00Z
## 22 2161 N752US LGA DCA 45 214 6 0 2013-07-01T10:00:00Z
## 23 461 N915DL LGA ATL 119 762 6 0 2013-07-01T10:00:00Z
## 24 4372 N21129 EWR MSP 154 1008 6 0 2013-07-01T10:00:00Z
## 25 4424 N18101 EWR RDU 69 416 6 0 2013-07-01T10:00:00Z
## 26 6177 N13908 EWR IAD 47 212 6 0 2013-07-01T10:00:00Z
## 27 301 N496AA LGA ORD 110 733 6 0 2013-07-01T10:00:00Z
## 28 3550 N521MQ LGA ATL 123 762 6 5 2013-07-01T10:00:00Z
## 29 1209 N11206 EWR LAX 300 2454 6 0 2013-07-01T10:00:00Z
## 30 3525 N721MQ LGA RDU 72 431 6 5 2013-07-01T10:00:00Z
## 31 707 N3DBAA LGA DFW 186 1389 6 0 2013-07-01T10:00:00Z
## 32 27 N559JB EWR MCO 136 937 6 0 2013-07-01T10:00:00Z
## 33 488 N253WN EWR HOU 201 1411 6 0 2013-07-01T10:00:00Z
## 34 597 N428UA EWR BOS 40 200 5 59 2013-07-01T09:00:00Z
## 35 350 N487UA LGA ORD 126 733 6 0 2013-07-01T10:00:00Z
## 36 1279 N363NB LGA MEM 140 963 6 5 2013-07-01T10:00:00Z
## 37 2180 N304JB EWR BOS 44 200 6 8 2013-07-01T10:00:00Z
## 38 1837 N3EYAA LGA MIA 159 1096 6 5 2013-07-01T10:00:00Z
## 39 601 N613JB JFK FLL 151 1069 6 9 2013-07-01T10:00:00Z
## 40 569 N498UA EWR ORD 109 719 6 0 2013-07-01T10:00:00Z
## 41 774 N811UA EWR RSW 154 1068 6 5 2013-07-01T10:00:00Z
## 42 303 N555UA JFK SFO 324 2586 6 10 2013-07-01T10:00:00Z
## 43 1403 N634JB JFK SJU 199 1598 6 11 2013-07-01T10:00:00Z
## 44 1919 N356NW LGA MSP 145 1020 6 10 2013-07-01T10:00:00Z
## 45 371 N584JB LGA FLL 150 1076 6 0 2013-07-01T10:00:00Z
## 46 3574 N556WN EWR MDW 103 711 6 5 2013-07-01T10:00:00Z
## 47 4963 N186PQ EWR MSP 150 1008 6 20 2013-07-01T10:00:00Z
## 48 273 N8317M LGA MDW 107 725 6 10 2013-07-01T10:00:00Z
## 49 1144 N87513 EWR MCO 130 937 6 15 2013-07-01T10:00:00Z
## 50 3267 N505MQ EWR ORD 106 719 6 0 2013-07-01T10:00:00Z
## 51 1895 N3HJAA EWR MIA 158 1085 6 15 2013-07-01T10:00:00Z
## 52 1447 N103US JFK CLT 87 541 6 15 2013-07-01T10:00:00Z
## [ reached 'max' / getOption("max.print") -- omitted 86274 rows ]## year month day dep_time sched_dep_time dep_delay arr_time sched_arr_time arr_delay carrier
## 1 2013 7 1 1 2029 212 236 2359 157 B6
## 2 2013 7 1 2 2359 3 344 344 0 B6
## 3 2013 7 1 29 2245 104 151 1 110 B6
## 4 2013 7 1 43 2130 193 322 14 188 B6
## 5 2013 7 1 44 2150 174 300 100 120 AA
## 6 2013 7 1 46 2051 235 304 2358 186 B6
## 7 2013 7 1 48 2001 287 308 2305 243 VX
## 8 2013 7 1 58 2155 183 335 43 172 B6
## 9 2013 7 1 100 2146 194 327 30 177 B6
## 10 2013 7 1 100 2245 135 337 135 122 B6
## 11 2013 7 1 107 2245 142 158 2359 119 B6
## 12 2013 7 1 111 2359 72 448 340 68 B6
## 13 2013 7 1 114 2135 219 310 8 182 B6
## 14 2013 7 1 459 500 -1 642 640 2 US
## 15 2013 7 1 538 540 -2 800 810 -10 UA
## 16 2013 7 1 540 540 0 841 840 1 AA
## 17 2013 7 1 543 545 -2 932 921 11 B6
## 18 2013 7 1 547 548 -1 903 851 12 UA
## 19 2013 7 1 548 545 3 815 819 -4 UA
## 20 2013 7 1 549 600 -11 645 655 -10 US
## 21 2013 7 1 551 600 -9 721 700 21 US
## 22 2013 7 1 554 600 -6 707 659 8 US
## 23 2013 7 1 556 600 -4 820 825 -5 DL
## 24 2013 7 1 557 600 -3 817 802 15 EV
## 25 2013 7 1 557 600 -3 727 730 -3 EV
## 26 2013 7 1 557 600 -3 719 716 3 EV
## 27 2013 7 1 557 600 -3 712 725 -13 AA
## 28 2013 7 1 557 605 -8 838 820 18 MQ
## 29 2013 7 1 557 600 -3 828 907 -39 UA
## 30 2013 7 1 559 605 -6 748 735 13 MQ
## 31 2013 7 1 600 600 0 836 830 6 AA
## 32 2013 7 1 600 600 0 839 834 5 B6
## 33 2013 7 1 600 600 0 848 840 8 WN
## 34 2013 7 1 600 559 1 700 720 -20 UA
## 35 2013 7 1 601 600 1 753 724 29 UA
## 36 2013 7 1 602 605 -3 752 745 7 DL
## 37 2013 7 1 603 608 -5 713 719 -6 B6
## 38 2013 7 1 604 605 -1 909 905 4 AA
## 39 2013 7 1 605 609 -4 901 859 2 B6
## 40 2013 7 1 605 600 5 717 727 -10 UA
## 41 2013 7 1 606 605 1 925 909 16 UA
## 42 2013 7 1 606 610 -4 847 924 -37 UA
## 43 2013 7 1 607 611 -4 948 954 -6 B6
## 44 2013 7 1 607 610 -3 823 807 16 DL
## 45 2013 7 1 609 600 9 902 851 11 B6
## 46 2013 7 1 610 605 5 713 720 -7 WN
## 47 2013 7 1 611 620 -9 820 817 3 EV
## 48 2013 7 1 611 610 1 723 725 -2 WN
## 49 2013 7 1 611 615 -4 842 857 -15 UA
## 50 2013 7 1 614 600 14 732 715 17 MQ
## 51 2013 7 1 615 615 0 923 910 13 AA
## 52 2013 7 1 615 615 0 809 808 1 US
## flight tailnum origin dest air_time distance hour minute time_hour
## 1 915 N653JB JFK SFO 315 2586 20 29 2013-07-02T00:00:00Z
## 2 1503 N805JB JFK SJU 200 1598 23 59 2013-07-02T03:00:00Z
## 3 234 N348JB JFK BTV 66 266 22 45 2013-07-02T02:00:00Z
## 4 1371 N794JB LGA FLL 143 1076 21 30 2013-07-02T01:00:00Z
## 5 185 N324AA JFK LAX 297 2475 21 50 2013-07-02T01:00:00Z
## 6 165 N640JB JFK PDX 304 2454 20 51 2013-07-02T00:00:00Z
## 7 415 N627VA JFK LAX 298 2475 20 1 2013-07-02T00:00:00Z
## 8 425 N535JB JFK TPA 140 1005 21 55 2013-07-02T01:00:00Z
## 9 1183 N531JB JFK MCO 126 944 21 46 2013-07-02T01:00:00Z
## 10 623 N663JB JFK LAX 304 2475 22 45 2013-07-02T02:00:00Z
## 11 1816 N249JB JFK SYR 39 209 22 45 2013-07-02T02:00:00Z
## 12 839 N608JB JFK BQN 199 1576 23 59 2013-07-02T03:00:00Z
## 13 611 N584JB JFK LAS 276 2248 21 35 2013-07-02T01:00:00Z
## 14 1431 N167US EWR CLT 87 529 5 0 2013-07-01T09:00:00Z
## 15 332 N442UA EWR IAH 185 1400 5 40 2013-07-01T09:00:00Z
## 16 701 N5ENAA JFK MIA 155 1089 5 40 2013-07-01T09:00:00Z
## 17 939 N708JB JFK BQN 198 1576 5 45 2013-07-01T09:00:00Z
## 18 651 N545UA EWR SFO 343 2565 5 48 2013-07-01T09:00:00Z
## 19 1714 N14237 LGA IAH 188 1416 5 45 2013-07-01T09:00:00Z
## 20 1629 N959UW LGA PHL 37 96 6 0 2013-07-01T10:00:00Z
## 21 2114 N751UW LGA BOS 38 184 6 0 2013-07-01T10:00:00Z
## 22 2161 N752US LGA DCA 45 214 6 0 2013-07-01T10:00:00Z
## 23 461 N915DL LGA ATL 119 762 6 0 2013-07-01T10:00:00Z
## 24 4372 N21129 EWR MSP 154 1008 6 0 2013-07-01T10:00:00Z
## 25 4424 N18101 EWR RDU 69 416 6 0 2013-07-01T10:00:00Z
## 26 6177 N13908 EWR IAD 47 212 6 0 2013-07-01T10:00:00Z
## 27 301 N496AA LGA ORD 110 733 6 0 2013-07-01T10:00:00Z
## 28 3550 N521MQ LGA ATL 123 762 6 5 2013-07-01T10:00:00Z
## 29 1209 N11206 EWR LAX 300 2454 6 0 2013-07-01T10:00:00Z
## 30 3525 N721MQ LGA RDU 72 431 6 5 2013-07-01T10:00:00Z
## 31 707 N3DBAA LGA DFW 186 1389 6 0 2013-07-01T10:00:00Z
## 32 27 N559JB EWR MCO 136 937 6 0 2013-07-01T10:00:00Z
## 33 488 N253WN EWR HOU 201 1411 6 0 2013-07-01T10:00:00Z
## 34 597 N428UA EWR BOS 40 200 5 59 2013-07-01T09:00:00Z
## 35 350 N487UA LGA ORD 126 733 6 0 2013-07-01T10:00:00Z
## 36 1279 N363NB LGA MEM 140 963 6 5 2013-07-01T10:00:00Z
## 37 2180 N304JB EWR BOS 44 200 6 8 2013-07-01T10:00:00Z
## 38 1837 N3EYAA LGA MIA 159 1096 6 5 2013-07-01T10:00:00Z
## 39 601 N613JB JFK FLL 151 1069 6 9 2013-07-01T10:00:00Z
## 40 569 N498UA EWR ORD 109 719 6 0 2013-07-01T10:00:00Z
## 41 774 N811UA EWR RSW 154 1068 6 5 2013-07-01T10:00:00Z
## 42 303 N555UA JFK SFO 324 2586 6 10 2013-07-01T10:00:00Z
## 43 1403 N634JB JFK SJU 199 1598 6 11 2013-07-01T10:00:00Z
## 44 1919 N356NW LGA MSP 145 1020 6 10 2013-07-01T10:00:00Z
## 45 371 N584JB LGA FLL 150 1076 6 0 2013-07-01T10:00:00Z
## 46 3574 N556WN EWR MDW 103 711 6 5 2013-07-01T10:00:00Z
## 47 4963 N186PQ EWR MSP 150 1008 6 20 2013-07-01T10:00:00Z
## 48 273 N8317M LGA MDW 107 725 6 10 2013-07-01T10:00:00Z
## 49 1144 N87513 EWR MCO 130 937 6 15 2013-07-01T10:00:00Z
## 50 3267 N505MQ EWR ORD 106 719 6 0 2013-07-01T10:00:00Z
## 51 1895 N3HJAA EWR MIA 158 1085 6 15 2013-07-01T10:00:00Z
## 52 1447 N103US JFK CLT 87 541 6 15 2013-07-01T10:00:00Z
## [ reached 'max' / getOption("max.print") -- omitted 86274 rows ]Solution a-d
It is possible to combine all four of the elements in Q6 into a single code sequence:
# with each step as a separate `filter()` statement
flights |>
  filter(arr_delay >= 120) |>
  filter(dest == "IAH" | dest == "HOU") |>
  filter(carrier %in% c("AA", "DL", "UA")) |>
  filter(month %in% 7:9)
## year month day dep_time sched_dep_time dep_delay arr_time sched_arr_time arr_delay carrier
## 1 2013 7 1 1310 1057 133 1551 1338 133 UA
## 2 2013 7 1 1707 1448 139 1943 1742 121 UA
## 3 2013 7 1 2058 1735 203 2355 2030 205 AA
## 4 2013 7 2 2001 1735 146 2335 2030 185 AA
## 5 2013 7 3 2215 1909 186 45 2200 165 UA
## 6 2013 7 9 1937 1735 122 2240 2030 130 AA
## 7 2013 7 10 40 1909 331 301 2200 301 UA
## 8 2013 7 10 1629 1520 69 2048 1754 174 UA
## 9 2013 7 10 1913 1721 112 2214 2001 133 UA
## 10 2013 7 17 1657 1446 131 2007 1745 142 UA
## 11 2013 7 18 2035 1721 194 2339 1958 221 UA
## 12 2013 7 22 1524 1249 155 1902 1541 201 UA
## 13 2013 7 22 2018 1735 163 2344 2030 194 AA
## 14 2013 7 22 2254 2114 100 219 2358 141 UA
## 15 2013 7 22 2328 2000 208 244 2244 240 UA
## 16 2013 7 23 824 638 106 1124 911 133 UA
## 17 2013 7 23 1204 855 189 1440 1156 164 UA
## 18 2013 7 23 2129 1702 267 2356 2003 233 UA
## 19 2013 7 23 2333 2000 213 154 2242 192 UA
## 20 2013 7 25 2147 1520 387 8 1754 374 UA
## 21 2013 7 25 2257 2000 177 108 2244 144 UA
## 22 2013 7 28 48 1900 348 315 2151 324 UA
## 23 2013 7 28 1728 1453 155 2027 1743 164 UA
## 24 2013 7 28 1942 1735 127 2306 2030 156 AA
## 25 2013 7 28 2101 1730 211 2338 2017 201 UA
## 26 2013 7 29 1209 720 289 1511 959 312 UA
## 27 2013 7 29 1229 1030 119 1527 1325 122 UA
## 28 2013 7 29 1943 1721 142 2218 1958 140 UA
## 29 2013 7 31 1924 1624 180 2205 1907 178 UA
## 30 2013 8 4 1948 1712 156 2233 2004 149 UA
## 31 2013 8 9 1850 1730 80 2221 2007 134 UA
## 32 2013 8 9 1928 1702 146 2221 2003 138 UA
## 33 2013 8 9 2251 2102 109 145 2344 121 UA
## 34 2013 8 16 1652 1259 233 1935 1551 224 UA
## 35 2013 8 17 1529 1030 299 1816 1322 294 UA
## 36 2013 8 22 1649 1417 152 1914 1653 141 UA
## 37 2013 8 22 1956 1735 141 2239 2030 129 AA
## 38 2013 8 28 1219 1030 109 1634 1331 183 UA
## 39 2013 8 28 1828 1449 219 2045 1750 175 UA
## 40 2013 9 2 1833 1520 193 2105 1810 175 UA
## 41 2013 9 2 1900 1629 151 2141 1915 146 UA
## 42 2013 9 2 1936 1725 131 2229 2015 134 UA
## 43 2013 9 2 2301 1700 361 157 1954 363 UA
## 44 2013 9 12 1802 1449 193 2311 1750 321 UA
## 45 2013 9 12 2157 1520 397 23 1810 373 UA
## 46 2013 9 22 2000 1700 180 2232 1955 157 AA
## 47 2013 9 25 1706 1156 310 1935 1438 297 UA
## flight tailnum origin dest air_time distance hour minute time_hour
## 1 1166 N27724 EWR IAH 197 1400 10 57 2013-07-01T14:00:00Z
## 2 1281 N76516 LGA IAH 195 1416 14 48 2013-07-01T18:00:00Z
## 3 1901 N3HTAA JFK IAH 203 1417 17 35 2013-07-01T21:00:00Z
## 4 1901 N3BRAA JFK IAH 205 1417 17 35 2013-07-02T21:00:00Z
## 5 1259 N17229 LGA IAH 188 1416 19 9 2013-07-03T23:00:00Z
## 6 1901 N3ARAA JFK IAH 174 1417 17 35 2013-07-09T21:00:00Z
## 7 1259 N76516 LGA IAH 185 1416 19 9 2013-07-10T23:00:00Z
## 8 646 N578UA EWR IAH 187 1400 15 20 2013-07-10T19:00:00Z
## 9 1497 N37281 EWR IAH 188 1400 17 21 2013-07-10T21:00:00Z
## 10 1744 N14242 LGA IAH 194 1416 14 46 2013-07-17T18:00:00Z
## 11 268 N537UA EWR IAH 168 1400 17 21 2013-07-18T21:00:00Z
## 12 215 N430UA LGA IAH 187 1416 12 49 2013-07-22T16:00:00Z
## 13 1901 N3CAAA JFK IAH 196 1417 17 35 2013-07-22T21:00:00Z
## 14 1740 N73275 EWR IAH 193 1400 21 14 2013-07-23T01:00:00Z
## 15 260 N402UA EWR IAH 194 1400 20 0 2013-07-23T00:00:00Z
## 16 226 N578UA EWR IAH 186 1400 6 38 2013-07-23T10:00:00Z
## 17 1058 N39728 LGA IAH 195 1416 8 55 2013-07-23T12:00:00Z
## 18 1661 N27722 LGA IAH 181 1416 17 2 2013-07-23T21:00:00Z
## 19 299 N523UA EWR IAH 179 1400 20 0 2013-07-24T00:00:00Z
## 20 646 N569UA EWR IAH 181 1400 15 20 2013-07-25T19:00:00Z
## 21 462 N416UA EWR IAH 167 1400 20 0 2013-07-26T00:00:00Z
## 22 1259 N18243 LGA IAH 189 1416 19 0 2013-07-28T23:00:00Z
## 23 1744 N14242 LGA IAH 193 1416 14 53 2013-07-28T18:00:00Z
## 24 1901 N3FYAA JFK IAH 200 1417 17 35 2013-07-28T21:00:00Z
## 25 1712 N37420 EWR IAH 185 1400 17 30 2013-07-28T21:00:00Z
## 26 349 N425UA LGA IAH 183 1416 7 20 2013-07-29T11:00:00Z
## 27 1257 N78506 LGA IAH 183 1416 10 30 2013-07-29T14:00:00Z
## 28 278 N547UA EWR IAH 171 1400 17 21 2013-07-29T21:00:00Z
## 29 1695 N19141 EWR IAH 177 1400 16 24 2013-07-31T20:00:00Z
## 30 408 N453UA LGA IAH 176 1416 17 12 2013-08-04T21:00:00Z
## 31 268 N524UA EWR IAH 182 1400 17 30 2013-08-09T21:00:00Z
## 32 1661 N17730 LGA IAH 182 1416 17 2 2013-08-09T21:00:00Z
## 33 682 N828UA EWR IAH 197 1400 21 2 2013-08-10T01:00:00Z
## 34 643 N428UA LGA IAH 198 1416 12 59 2013-08-16T16:00:00Z
## 35 545 N470UA LGA IAH 211 1416 10 30 2013-08-17T14:00:00Z
## 36 112 N78509 EWR IAH 176 1400 14 17 2013-08-22T18:00:00Z
## 37 1901 N3EEAA JFK IAH 182 1417 17 35 2013-08-22T21:00:00Z
## 38 1257 N76528 LGA IAH 184 1416 10 30 2013-08-28T14:00:00Z
## 39 501 N426UA LGA IAH 177 1416 14 49 2013-08-28T18:00:00Z
## 40 498 N497UA EWR IAH 184 1400 15 20 2013-09-02T19:00:00Z
## 41 1052 N18119 EWR IAH 185 1400 16 29 2013-09-02T20:00:00Z
## 42 596 N457UA EWR IAH 194 1400 17 25 2013-09-02T21:00:00Z
## 43 525 N851UA LGA IAH 186 1416 17 0 2013-09-02T21:00:00Z
## 44 501 N457UA LGA IAH 194 1416 14 49 2013-09-12T18:00:00Z
## 45 498 N465UA EWR IAH 175 1400 15 20 2013-09-12T19:00:00Z
## 46 211 N3DDAA JFK IAH 184 1417 17 0 2013-09-22T21:00:00Z
## 47 598 N668UA EWR IAH 184 1400 11 56 2013-09-25T15:00:00ZWe could go one step further and combine it all into a single filter() function:
flights |>
  filter(arr_delay >= 120 &
           dest %in% c("IAH", "HOU") &
           carrier %in% c("AA", "DL", "UA") &
           month %in% 7:9)
## year month day dep_time sched_dep_time dep_delay arr_time sched_arr_time arr_delay carrier
## 1 2013 7 1 1310 1057 133 1551 1338 133 UA
## 2 2013 7 1 1707 1448 139 1943 1742 121 UA
## 3 2013 7 1 2058 1735 203 2355 2030 205 AA
## 4 2013 7 2 2001 1735 146 2335 2030 185 AA
## 5 2013 7 3 2215 1909 186 45 2200 165 UA
## 6 2013 7 9 1937 1735 122 2240 2030 130 AA
## 7 2013 7 10 40 1909 331 301 2200 301 UA
## 8 2013 7 10 1629 1520 69 2048 1754 174 UA
## 9 2013 7 10 1913 1721 112 2214 2001 133 UA
## 10 2013 7 17 1657 1446 131 2007 1745 142 UA
## 11 2013 7 18 2035 1721 194 2339 1958 221 UA
## 12 2013 7 22 1524 1249 155 1902 1541 201 UA
## 13 2013 7 22 2018 1735 163 2344 2030 194 AA
## 14 2013 7 22 2254 2114 100 219 2358 141 UA
## 15 2013 7 22 2328 2000 208 244 2244 240 UA
## 16 2013 7 23 824 638 106 1124 911 133 UA
## 17 2013 7 23 1204 855 189 1440 1156 164 UA
## 18 2013 7 23 2129 1702 267 2356 2003 233 UA
## 19 2013 7 23 2333 2000 213 154 2242 192 UA
## 20 2013 7 25 2147 1520 387 8 1754 374 UA
## 21 2013 7 25 2257 2000 177 108 2244 144 UA
## 22 2013 7 28 48 1900 348 315 2151 324 UA
## 23 2013 7 28 1728 1453 155 2027 1743 164 UA
## 24 2013 7 28 1942 1735 127 2306 2030 156 AA
## 25 2013 7 28 2101 1730 211 2338 2017 201 UA
## 26 2013 7 29 1209 720 289 1511 959 312 UA
## 27 2013 7 29 1229 1030 119 1527 1325 122 UA
## 28 2013 7 29 1943 1721 142 2218 1958 140 UA
## 29 2013 7 31 1924 1624 180 2205 1907 178 UA
## 30 2013 8 4 1948 1712 156 2233 2004 149 UA
## 31 2013 8 9 1850 1730 80 2221 2007 134 UA
## 32 2013 8 9 1928 1702 146 2221 2003 138 UA
## 33 2013 8 9 2251 2102 109 145 2344 121 UA
## 34 2013 8 16 1652 1259 233 1935 1551 224 UA
## 35 2013 8 17 1529 1030 299 1816 1322 294 UA
## 36 2013 8 22 1649 1417 152 1914 1653 141 UA
## 37 2013 8 22 1956 1735 141 2239 2030 129 AA
## 38 2013 8 28 1219 1030 109 1634 1331 183 UA
## 39 2013 8 28 1828 1449 219 2045 1750 175 UA
## 40 2013 9 2 1833 1520 193 2105 1810 175 UA
## 41 2013 9 2 1900 1629 151 2141 1915 146 UA
## 42 2013 9 2 1936 1725 131 2229 2015 134 UA
## 43 2013 9 2 2301 1700 361 157 1954 363 UA
## 44 2013 9 12 1802 1449 193 2311 1750 321 UA
## 45 2013 9 12 2157 1520 397 23 1810 373 UA
## 46 2013 9 22 2000 1700 180 2232 1955 157 AA
## 47 2013 9 25 1706 1156 310 1935 1438 297 UA
## flight tailnum origin dest air_time distance hour minute time_hour
## 1 1166 N27724 EWR IAH 197 1400 10 57 2013-07-01T14:00:00Z
## 2 1281 N76516 LGA IAH 195 1416 14 48 2013-07-01T18:00:00Z
## 3 1901 N3HTAA JFK IAH 203 1417 17 35 2013-07-01T21:00:00Z
## 4 1901 N3BRAA JFK IAH 205 1417 17 35 2013-07-02T21:00:00Z
## 5 1259 N17229 LGA IAH 188 1416 19 9 2013-07-03T23:00:00Z
## 6 1901 N3ARAA JFK IAH 174 1417 17 35 2013-07-09T21:00:00Z
## 7 1259 N76516 LGA IAH 185 1416 19 9 2013-07-10T23:00:00Z
## 8 646 N578UA EWR IAH 187 1400 15 20 2013-07-10T19:00:00Z
## 9 1497 N37281 EWR IAH 188 1400 17 21 2013-07-10T21:00:00Z
## 10 1744 N14242 LGA IAH 194 1416 14 46 2013-07-17T18:00:00Z
## 11 268 N537UA EWR IAH 168 1400 17 21 2013-07-18T21:00:00Z
## 12 215 N430UA LGA IAH 187 1416 12 49 2013-07-22T16:00:00Z
## 13 1901 N3CAAA JFK IAH 196 1417 17 35 2013-07-22T21:00:00Z
## 14 1740 N73275 EWR IAH 193 1400 21 14 2013-07-23T01:00:00Z
## 15 260 N402UA EWR IAH 194 1400 20 0 2013-07-23T00:00:00Z
## 16 226 N578UA EWR IAH 186 1400 6 38 2013-07-23T10:00:00Z
## 17 1058 N39728 LGA IAH 195 1416 8 55 2013-07-23T12:00:00Z
## 18 1661 N27722 LGA IAH 181 1416 17 2 2013-07-23T21:00:00Z
## 19 299 N523UA EWR IAH 179 1400 20 0 2013-07-24T00:00:00Z
## 20 646 N569UA EWR IAH 181 1400 15 20 2013-07-25T19:00:00Z
## 21 462 N416UA EWR IAH 167 1400 20 0 2013-07-26T00:00:00Z
## 22 1259 N18243 LGA IAH 189 1416 19 0 2013-07-28T23:00:00Z
## 23 1744 N14242 LGA IAH 193 1416 14 53 2013-07-28T18:00:00Z
## 24 1901 N3FYAA JFK IAH 200 1417 17 35 2013-07-28T21:00:00Z
## 25 1712 N37420 EWR IAH 185 1400 17 30 2013-07-28T21:00:00Z
## 26 349 N425UA LGA IAH 183 1416 7 20 2013-07-29T11:00:00Z
## 27 1257 N78506 LGA IAH 183 1416 10 30 2013-07-29T14:00:00Z
## 28 278 N547UA EWR IAH 171 1400 17 21 2013-07-29T21:00:00Z
## 29 1695 N19141 EWR IAH 177 1400 16 24 2013-07-31T20:00:00Z
## 30 408 N453UA LGA IAH 176 1416 17 12 2013-08-04T21:00:00Z
## 31 268 N524UA EWR IAH 182 1400 17 30 2013-08-09T21:00:00Z
## 32 1661 N17730 LGA IAH 182 1416 17 2 2013-08-09T21:00:00Z
## 33 682 N828UA EWR IAH 197 1400 21 2 2013-08-10T01:00:00Z
## 34 643 N428UA LGA IAH 198 1416 12 59 2013-08-16T16:00:00Z
## 35 545 N470UA LGA IAH 211 1416 10 30 2013-08-17T14:00:00Z
## 36 112 N78509 EWR IAH 176 1400 14 17 2013-08-22T18:00:00Z
## 37 1901 N3EEAA JFK IAH 182 1417 17 35 2013-08-22T21:00:00Z
## 38 1257 N76528 LGA IAH 184 1416 10 30 2013-08-28T14:00:00Z
## 39 501 N426UA LGA IAH 177 1416 14 49 2013-08-28T18:00:00Z
## 40 498 N497UA EWR IAH 184 1400 15 20 2013-09-02T19:00:00Z
## 41 1052 N18119 EWR IAH 185 1400 16 29 2013-09-02T20:00:00Z
## 42 596 N457UA EWR IAH 194 1400 17 25 2013-09-02T21:00:00Z
## 43 525 N851UA LGA IAH 186 1416 17 0 2013-09-02T21:00:00Z
## 44 501 N457UA LGA IAH 194 1416 14 49 2013-09-12T18:00:00Z
## 45 498 N465UA EWR IAH 175 1400 15 20 2013-09-12T19:00:00Z
## 46 211 N3DDAA JFK IAH 184 1417 17 0 2013-09-22T21:00:00Z
## 47 598 N668UA EWR IAH 184 1400 11 56 2013-09-25T15:00:00Z-30-