Assignment week 5: optional {#assignment5}
library(tidyverse) # functions using {tidyr}, {dplyr}, and {readr}
library(readxl)    # to read Excel files

library(Lahman)    # Major League Baseball database
Introduction
NOTE: This optional assignment is for those course participants who were not able to complete one of assignments #1–#3.
For this homework assignment, please write your answer for each question after the question text but before the line break before the next one.
In some cases, you will have to insert R code chunks, and run them to ensure that you’ve got the right result.
Use all of the R Markdown formatting you want! Bullets, bold text, etc. is welcome. And don’t forget to consider changes to the YAML.
Once you have finished your assignment, create an HTML document by “knitting” the document using either the “Preview” or “Knit” button in the top left of the script window frame
1. Where do Major League Baseball players come from?
The 30 Major League Baseball teams play in cities in the United States and Canada (only Toronto!), but draw the best players from around the world. In this problem you will create a table and a chart to show the country of birth of the players in the 2020 season.
For this we will use the data stored in the R package that contains the Lahman baseball database (named after Sean Lahman, the person who initially created the database).
The Lahman package is loaded into your environment with the library(Lahman) function above.
We can get a listing of the tables in this database with either
typing
?Lahmanin the console orthe
LahmanDatafunction.
LahmanData## file class nobs nvar title
## 1 AllstarFull data.frame 5454 8 AllstarFull table
## 2 Appearances data.frame 110423 21 Appearances table
## 3 AwardsManagers data.frame 179 6 AwardsManagers table
## 4 AwardsPlayers data.frame 6531 6 AwardsPlayers table
## 5 AwardsShareManagers data.frame 425 7 AwardsShareManagers table
## 6 AwardsSharePlayers data.frame 6879 7 AwardsSharePlayers table
## 7 Batting data.frame 110495 22 Batting table
## 8 BattingPost data.frame 15879 22 BattingPost table
## 9 CollegePlaying data.frame 17350 3 CollegePlaying table
## 10 Fielding data.frame 147080 18 Fielding table
## 11 FieldingOF data.frame 12028 6 FieldingOF table
## 12 FieldingOFsplit data.frame 34563 18 FieldingOFsplit table
## 13 FieldingPost data.frame 15063 17 FieldingPost data
## 14 HallOfFame data.frame 4191 9 Hall of Fame Voting Data
## 15 HomeGames data.frame 3195 9 HomeGames table
## 16 Managers data.frame 3684 10 Managers table
## 17 ManagersHalf data.frame 93 10 ManagersHalf table
## 18 Parks data.frame 255 6 Parks table
## 19 People data.frame 20370 26 People table
## 20 Pitching data.frame 49430 30 Pitching table
## 21 PitchingPost data.frame 6308 30 PitchingPost table
## 22 Salaries data.frame 26428 5 Salaries table
## 23 Schools data.frame 1207 5 Schools table
## 24 SeriesPost data.frame 367 9 SeriesPost table
## 25 Teams data.frame 2985 48 Teams table
## 26 TeamsFranchises data.frame 120 4 TeamFranchises table
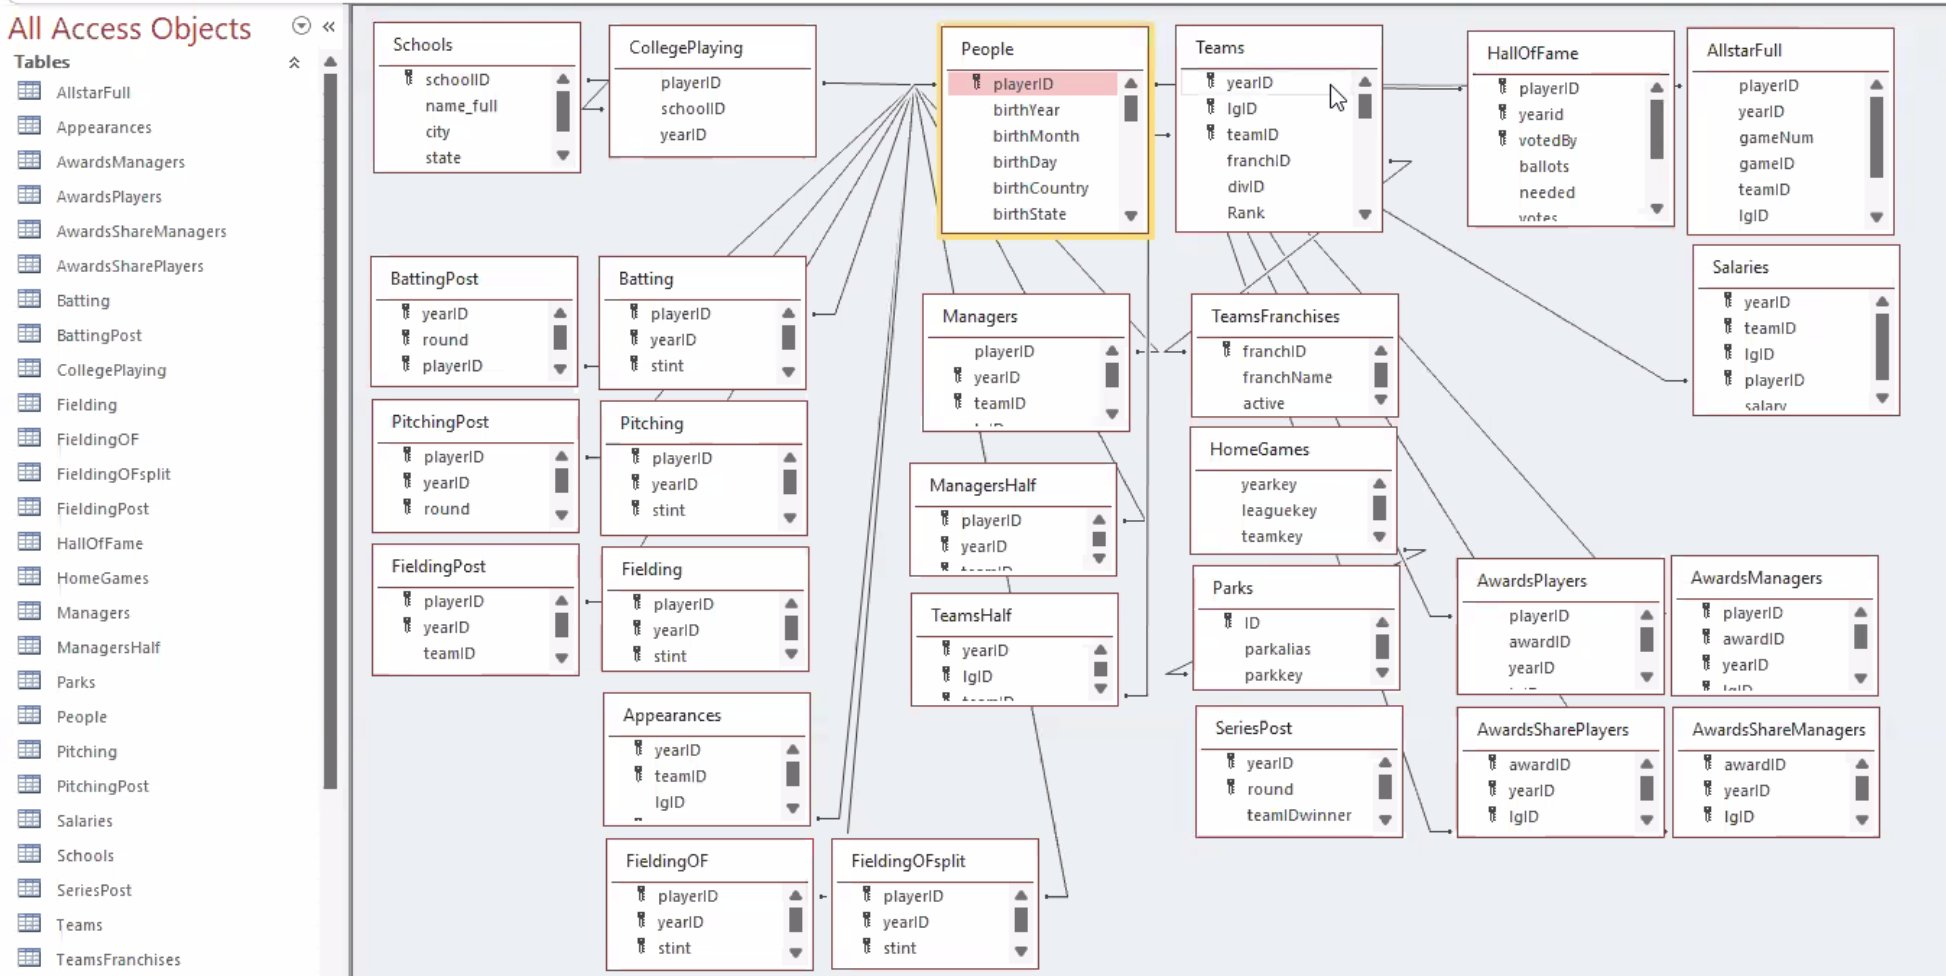
## 27 TeamsHalf data.frame 52 10 TeamsHalf tableHere is an ER (Entity Relationship) diagram, showing the key relationships between each table. (Open the image in a new tab to see it full size.)
2. The B.C. residential housing market
The file “municipal_monthly_2021.xlsx” has a variety of statistics, collected by the B.C. Ministry of Finance through the Property Transfer Tax.
2.b Wrangle
(marks: 3)
-
Calculate the average sales price of residential properties for the full year (i.e. all 12 months), for each municipality in the data. Notes:
“RESIDENTIAL TOTAL (count)” gives the total number of residential transactions
“FMV SUM - RESIDENTIAL ($ sum)” gives the total sales value of those transactions (“FMV” is short for Fair Market Value, a value used to calculate the tax when a property changes hands at a below-market-value price, such as a $1 sale between family members.)
Some rural areas are in multiple regional districts!
At the end of this process, you will end up with a table that looks something like this:
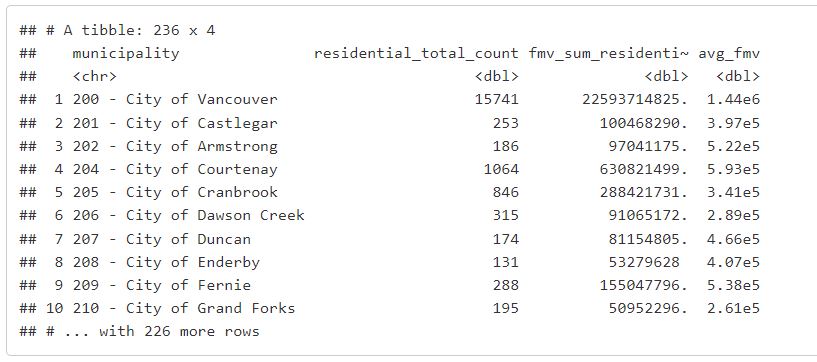
# solution