30 COVID-19 case numbers in British Columbia
30.1 Introduction
As the COVID-19 pandemic enters its next phase, the number of cases in British Columbia is increasing.
Here are two charts by Jens von Bergmann.
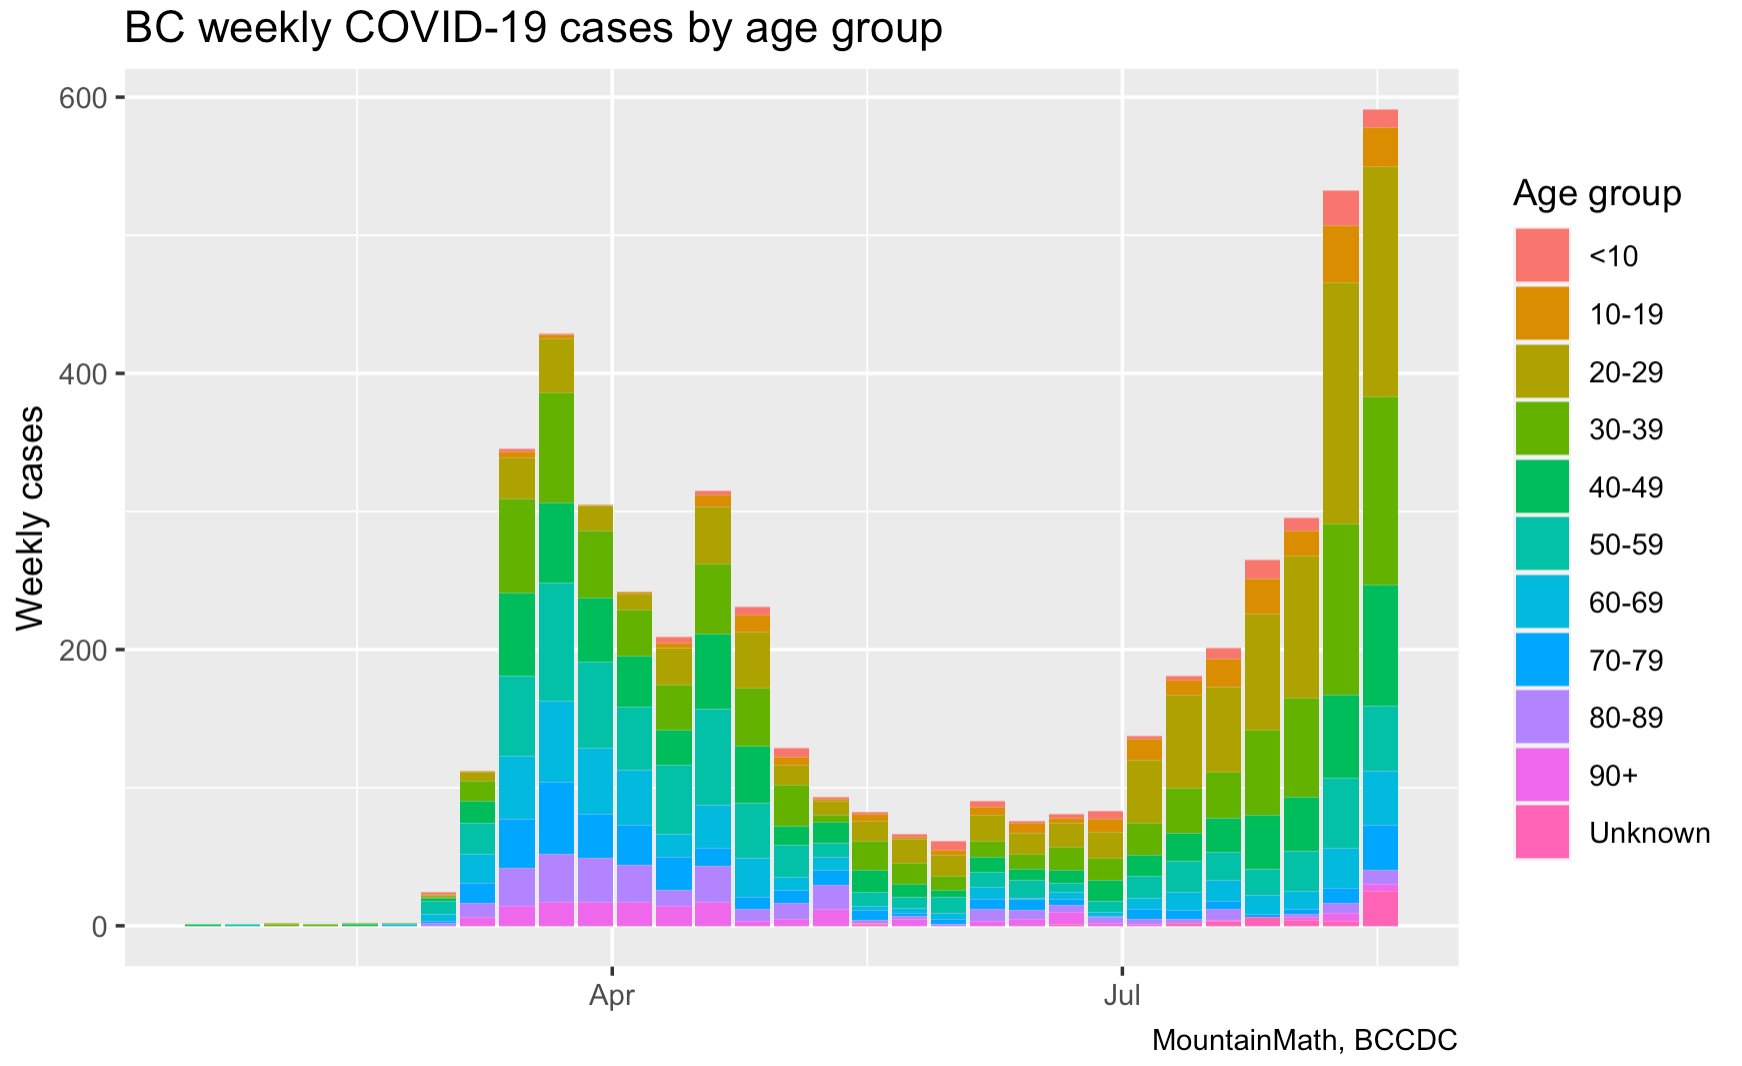
From August 25, 2020 showing cases by age group:
From November 9, 2020 showing new cases by Health Authority region, on a “per 100K population” basis:
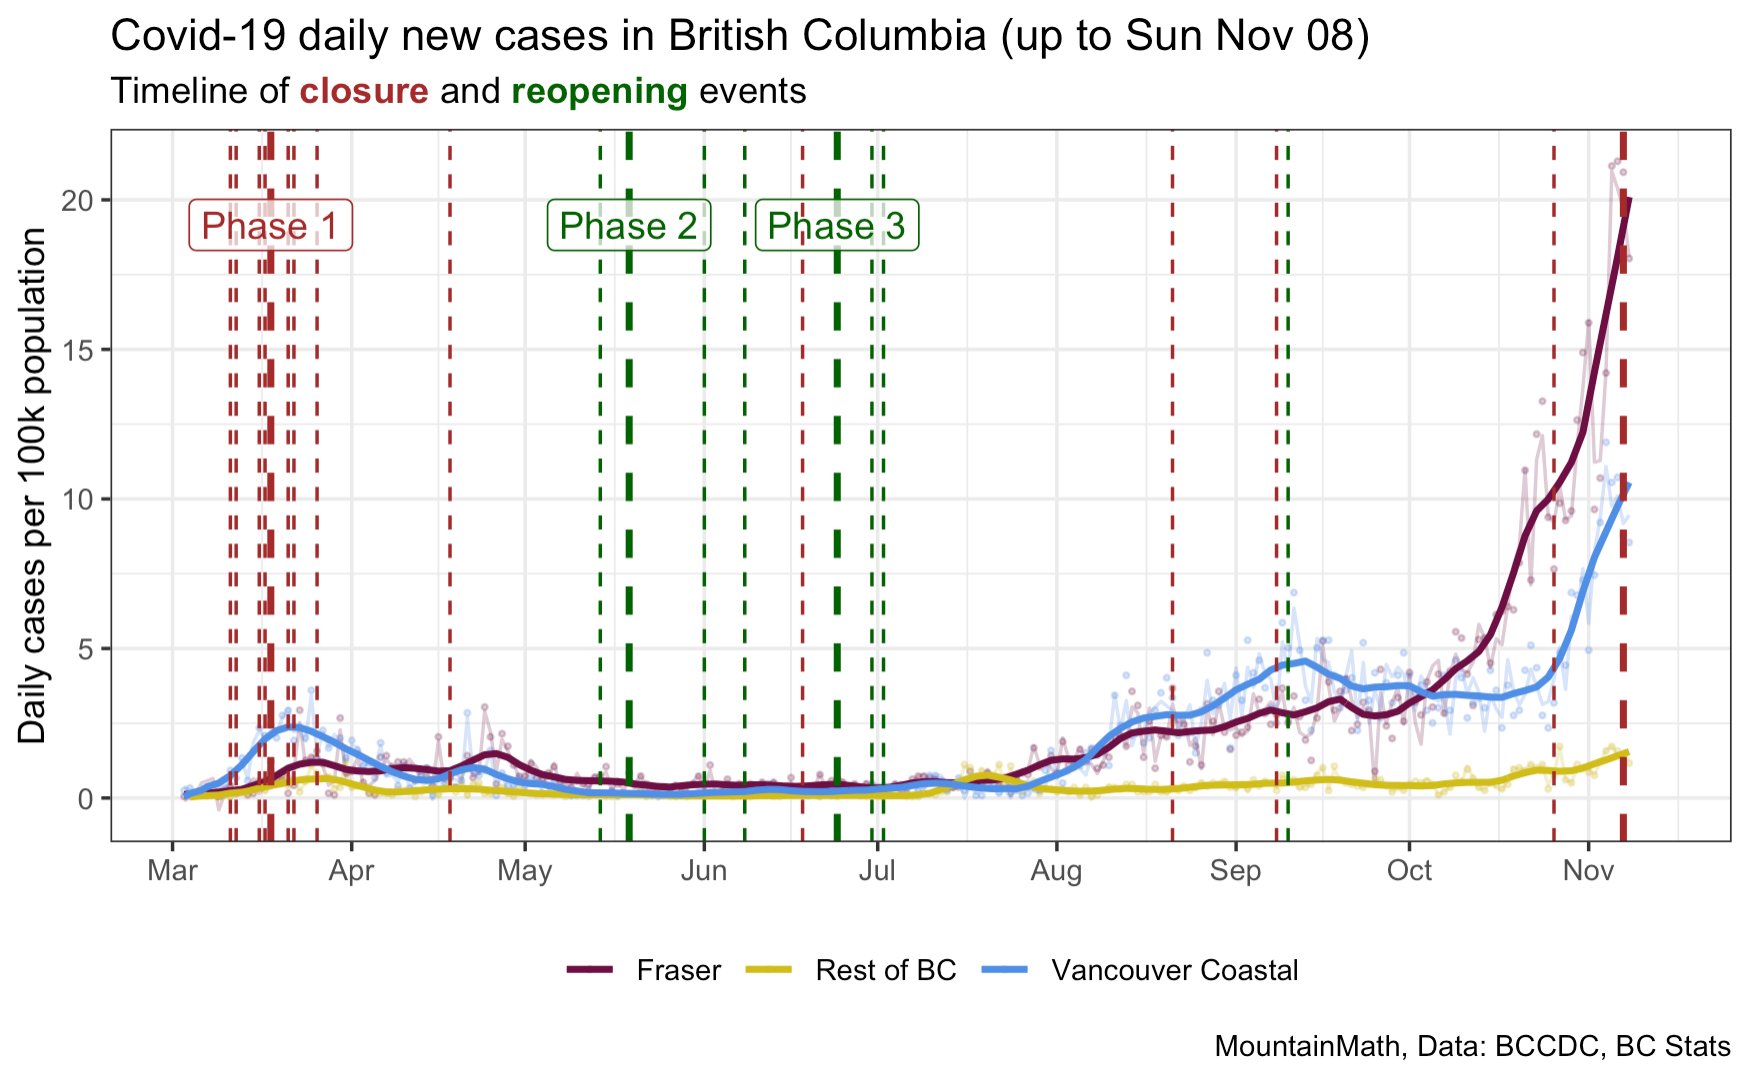
For this chart, you do not have to add the vertical lines (showing).
As well, you’ll need to group the three health authority regions into one. A tool for doing that is the case_when() function in {dplyr}:
30.1.1 Other visualizations of data from the same source
https://twitter.com/vb_jens/status/1323423179390418944?s=20
Animations:
30.2 Going beyond
An idea for going beyond the two charts above would be to use the facet functionality of {ggplot2} to draw a separate case rate plot (similar to the data in the second chart) for each of the five health authority regions. (The plot above combines three of them into the “Other BC” line, but after the original plot was made, the case rates in some of the other regions were also high.)
30.3 Data source
Source: COVID-19 Canada Open Data Working Group
opencovid.ca GitHub repository
-30-