26 Introduction
26.1 Project description
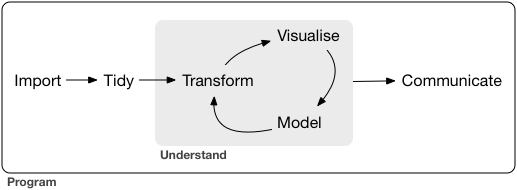
A small project that will require the application of all of the concepts introduced
importing data
data wrangling—all the necessary data tidying and transformations
data modeling and summarization
communication (including tabular and plotting visualization)
To do this, you will have the end already defined: a summary table and/or a plot of some data that has been published.
- In the defined projects, you are to replicate a summary table and plot—you will have all the necessary data, and the end-goal. It’s up to you to use your data analytics coding skills to create that summary table, plot.
The capstone project will be introduced in Unit 4.
Some projects will be available for you to choose, and are described in the chapters that follow.
You may also bring your own data. Talk to the instructor to ensure that your project goals are suitable; past experience has indicated that “projects from home” are likely to be more than is required for this course! We can work to ensure that the scope is feasible for the time available, and will set you up for further development (beyond what is required for the course) if you want to continue.
26.2 Submission
Please submit both your .Rmd file and the HTML output that results when you knit the R Markdown file.
These files will contain your code, any tables and plots that the code generates, and the supporting documentation.
If this was to be printed out, it would be between 5 and 10 pages in length—but here we’re working with digital documents, so that might be hard to judge!
26.3 Project assessment
| MARKS | OUTCOME |
|---|---|
| 5 | data import, including defining the variable types |
| 10 | tidying and manipulation |
| 10 | visualization—tables and plots |
| 5 | going beyond—this might include adding an additional table, plot, or statistical model, or using functions so that your code isn’t as WET |
| 10 | documentation throughout, explaining what the following R code chunk is doing |
| 40 | TOTAL |
26.3.1 A note about documentation
You can add documentation as both comments inside code chunks and text (in the form of paragraphs or bullet points) outside.
Things to think about adding are:
What: explain what the code chunk is doing (for example, you might write “Here the first table is joined to the second table”)
Why: explain the choices you made (“I decided to see if there was a difference between group #1 and group #2, so I did the following”)
How: explain things that are happening in the code (“Note that the joining variable has a different name in each table” or “I had to change the variable from character to integer so that the line graph would work”)
What: analysis of what the results show (“This chart shows a bigger increase in the first thing than the second thing”)
For an example of what your documentation might look like, refer to the chapter from Unit 1, An example of a data analytics project.
-30-