28 Labour force participation of women with children
28.1 Introduction
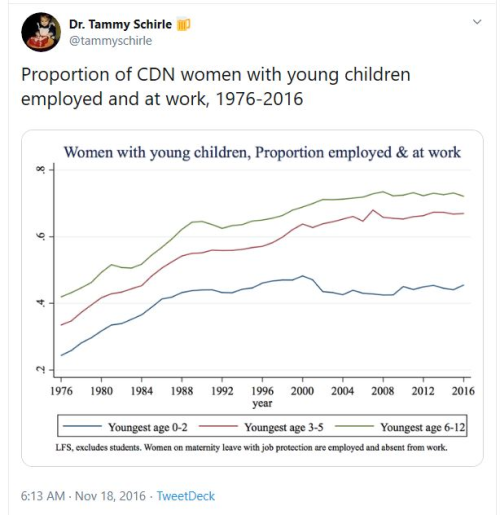
On 2016-11-18, Dr. Tammy Schirle posted a series of tweets (now deleted) via her twitter account, showing the proportion of Canadian women with young children, employed and at work, from 1976-2015.

For this project, you will recreate your own version of this chart (note that the variables are slightly different than what’s shown). Then, once you have completed the Canada version, make a second version using British Columbia data.
28.2 Going Beyond
One way to analyze time series data such as this is to calculate and plot the rate of change from one point in time to the next. A way to do this is with the lag and lead functions in {dplyr}:
Another element in economic data analysis is the impact of recessions, which is usually associated with a drop in the level of employment. You could use your skills with plot annotation elements to show where the recessions in Canada occurred, and whether that is associated with drops or slower growth in employment.
28.2.1 {cansim} package
You will receive a data file that contains the data necessary to complete this project. If you are interested in exploring a method of accessing the latest data directly from Statistics Canada, you can use the {cansim} R package. The reference page for the package is here: https://mountainmath.github.io/cansim/
28.3 Data source
Source: Statistics Canada, Labour Force Survey, Labour force characteristics by family age composition, annual
Table: 14-10-0120-01 (formerly CANSIM 282-0211)
28.4 References
Kourtney Kobel and Tammy Schirle, “The differential impact of universal child benefits on the labor supply of married and single mothers”
Tyler Cowen, 2016, “Why is female labor force participation down?” - U.S. measures
-30-