Assignment 2 - week 3 - exploratory data analysis {#assignment3}
Introduction
For this homework assignment, please write your answer for each question after the question text but before the line break before the next one.
In some cases, you will have to insert R code chunks, and run them to ensure that you’ve got the right result.
Use all of the R Markdown formatting you want! Bullets, bold text, etc. is welcome. And don’t forget to consider changes to the YAML.
Once you have finished your assignment, create an HTML document by “knitting” the document using either the “Preview” or “Knit” button in the top left of the script window frame
New Homes Registry
The B.C. Ministry of Municipal Affairs and Housing publishes data from BC Housing’s New Homes Registry, by regional district and municipality, by three types types of housing: single detached, multi-unit homes, and purpose built rental.9
The name of the file is “bc-stats_2018-new-homes-data_tosend.xlsx”
Packages used
This exercise relies on the following packages:
{readxl}
in particular, review the “Overview” page and the “Articles”
{ggplot2}
You will also require functions from {dplyr}, {tidyr}, and (potentially) {forcats}.
1. Explore the file
(marks: 1)
List the sheet names in the file. (You may wish to assign the long and cumbersome name of the source file to a character string object with a shorter, more concise name.)
2. Importing a sheet
(marks: 3)
Here’s a screenshot of the top rows of the sheet with single detached housing:
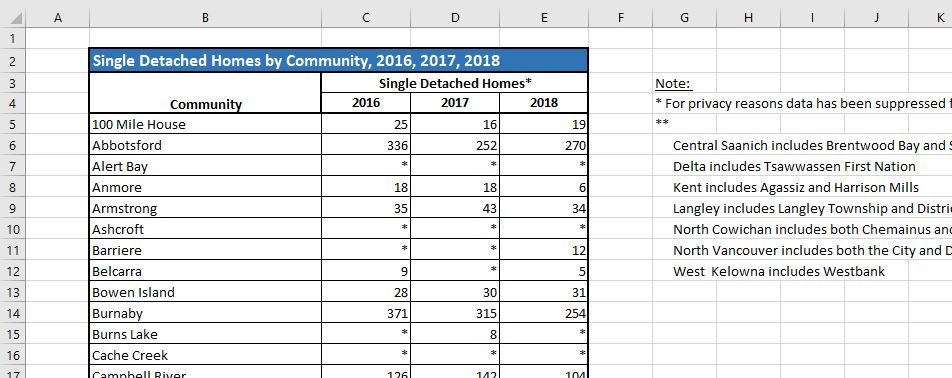
What problems do you anticipate with the way this sheet is laid out?
In Question 5, you will be making a plot that uses data from this sheet. Will you need all of the rows and columns that contain information of one kind or another?
What are the data types of each column in the Excel file? Ask yourself things like “What is the variable type of this column? What type do I think R will interpret this as?”
Read in the sheet, using no options. What is notable about the content of the R data table, compared to the Excel source?
Read the contents of the file again, so that the header rows are in the right place, and with the “Note:” column omitted.
(See this page on the {readxl} reference material for some tips.)
Note: there are many possible solutions to this problem. Once you’ve created an object that you can manipulate in the R environment, your solution may involve some of the {dplyr} data manipulations.
3. Tidy data
(marks: 2)
Does this data frame violate any of the principles of tidy data?
If so, use the pivot functions from {tidyr} to turn it into a tidy structure.
4. Joining tables
(marks: 4)
Because the structure of the data in the Excel file is consistent, we can copy-and-paste and edit our code above, and assemble the contents of the three sheets into a single data table.
Repeat the import and tidy steps for the sheets containing the data for multi-unit homes and purpose built rental, and assign each to a unique object. At the end of this step you will have three tidy data frame objects in your environment, one each for single detached, multi-unit homes, and purpose built rentals.
Now join the three tables, creating a single table that contains all of the information that was previously stored in three separate sheets.
5. EDA: plotting
(marks: 6)
Now you’ve got a tidy structure, it’s time for some exploratory data analysis!
Plot the total number of housing units built in B.C. by municipality, but only the 10 municipalities with the greatest number of homes built, sorted from most to least. (I will leave it up to you to decide if you want to do that by a single year or by the total of all three years in the data.)
Hints and resources:
The Data visualisation and Exploratory data analysis chapters of R for Data Science, 2nd ed. might be handy references
The Factors chapter of R for Data Science, 2nd ed.
You might need to do further data manipulation before you can plot what you want
Sometimes I find it very helpful to make a sketch of the plot I envision, and then writing down which variables are associated with the bits on the plot
-30-