33 New vehicle registrations
33.1 Introduction
For this project, you will analyze trends in motor vehicle sales in Canada, by fuel type of the vehicle. Part of this project is exploratory data analysis; a plot hasn’t been published to show the trends, so you might create a number of different versions to find a compelling way to visualize the data.
Statistics Canada publishes these data; the most recent release with some analysis can be found here: New motor vehicle registrations, second quarter 2021.
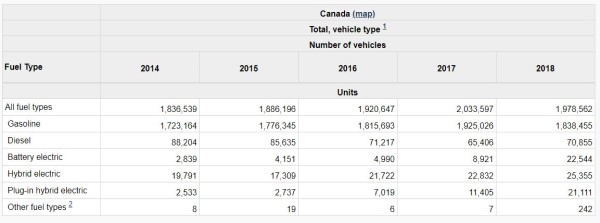
Part of your project will create two tables: one is the Canadian totals, and it will look something like this table that was published in 2019.
- Note that the multi-row header is possible in R, but don’t worry if you can’t get it perfectly. For example, the “Units” row seems redundant, and the hypertext links are beyond the scope of the project.
For this project, you will also create a second table that is identical to the one above, but with British Columbia numbers.
Note that the table above shows the years from 2014–2018. The data in the folder covers a larger range than what is shown in the table; Statistics Canada’s publications tend to summarize the available data to save space. For many applications (including this course) you will want to review as much data as is available! More data points will give you a clearer sense of what the trends might be.
The second part is to create a plot or plots that demonstrate an interesting aspect of the data. This could be:
change over time, including using the quarterly data series (the table in the file “20100024.csv”). Does the quarterly data show the impact of the COVID-19 pandemic on vehicle sales?
comparisons by fuel type, or
comparisons of the Canadian total to British Columbia,
or some other element you find in the data.
33.2 Going Beyond
33.2.1 {cansim} package
You will receive a data file that contains the data necessary to complete this project. If you are interested in exploring a method of accessing the latest data directly from Statistics Canada, you can use the {cansim} R package. The reference page for the package is here: https://mountainmath.github.io/cansim/
33.3 Data source
The data for this project are in the “data” folder.
The data were sourced from:
Annual data: Statistics Canada. Table 20-10-0021-01 New motor vehicle registrations
Quarterly data: Statistics Canada. Table 20-10-0024-01 New motor vehicle registrations
-30-