28 Gapminder: Aging Europe
28.1 Introduction
In this project, you will recreate an approximation of the chart Hans Rosling shows in the video here:
- Presentation Zen, Hans Rosling: the zen master of presenting data, 2010-07-11
This image captures the 1961 version of the plot:
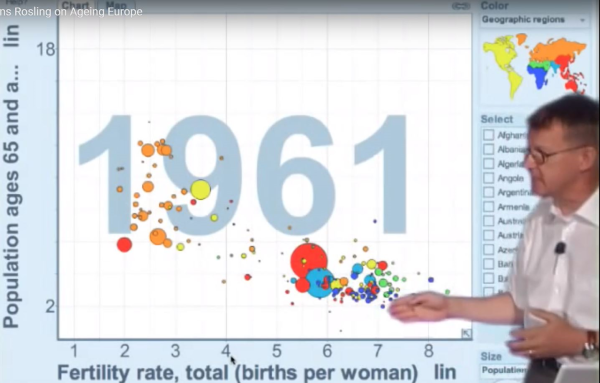
Make three versions of the chart, each showing a different year.
28.2 Data files
There are four files from https://www.gapminder.org/data/ that you will need; these are in the “data” folder.
There are CSV files for the following:
Population, total: “population_total.csv”
Population, aged 60+: “population_aged_60plus_years_total_number.csv”
Babies per woman (total fertility): “children_per_woman_total_fertility.csv”
In addition, there is an Excel file that you’ll need to use to get the region that each country is in.
- “Data Geographies - v1 - by Gapminder.xlsx”, sheet = “list-of-countries-etc”
28.3 References
For additional references, including examples of using {gganimate}, see the page for the capstone project Gapminder: 200 Countries, 200 Years.