Data Analytics Coding Fundamentals (DAMS302)
Latest update: 2025-11-14
This book is based on the lessons for DAMS302, “Data Analytics Coding Fundamentals”, offered at the University of Victoria’s Continuing Studies Department.
Note that the course was previously part of the Business Intelligence & Data Analytics series, numbered BIDA302.
Course Outline
Course description
From UVic Continuing Studies website
This course will explore the fundamentals of coding and scripting for Data Analytics. You will develop the ability to script and code for basic tasks in Data Analytics in common data analytic tools such as R, Python, and Excel. This will allow you to import and export data appropriately and perform fundamental data manipulations and to automate basic analysis elements.
Note that the emphasis of the course will be learning R. The concepts learned in that programming language can be applied in others; we will explore similar functions in Python towards the end of the course.
Learning objectives
DAMS302 learning objectives:
By the end of this course, you should be able to:
Perform basic data manipulations
Create variables
Apply key concepts of variables, constants and functions
Calculate descriptive statistics
Perform basic logical formula functions
Group and ungroup data
Data Importing
Data Exporting
Extract and combine data
Create what-if scenarios
Text books and other readings
In addition to the material in this ebook, the text book for this course is R for Data Science (2nd edition) by Hadley Wickham, Mine Çetinkaya-Rundel, and Garret Grolemund (Wickham, Çetinkaya-Rundel, and Grolemund 2023). While the book is available for purchase from your favourite bookseller, it also has a free online version at r4ds.hadley.nz
- Solutions to the exercises can be found at https://mine-cetinkaya-rundel.github.io/r4ds-solutions/
For some elements, we will refer to the first edition of R for Data Science (by Garrett Grolemund and Hadley Wickham) (Wickham and Grolemund 2016). Like the 2nd edition, the first edition of R for Data Science is also exists as a freely available online text at r4ds.had.co.nz.
A useful reference book for this course is JD Long & Paul Teetor, R Cookbook, 2nd edition. It’s also available both as a printed book and online at rc2e.com/
Additional readings and reference material are noted in each section, and included in the comprehensive bibliography.
Code of Conduct
The R Consortium and R Community Code of Conduct serves well for us. This class,
like the R community as a whole, is made up of members from around the globe with a diverse set of skills, personalities, and experiences. It is through these differences that our community experiences great successes and continued growth.
Please
follow these guidelines which help steer our interactions and strive to keep R a positive, successful, and growing community.
R Community Code of Conduct
A member of the R Community is:
Open: Members of the community are open to collaboration, whether it’s on projects, working groups, packages, problems, or otherwise. We’re receptive to constructive comment and criticism, as the experiences and skill sets of other members contribute to the whole of our efforts. We’re accepting of anyone who wishes to take part in our activities, fostering an environment where all can participate and everyone can make a difference.
Considerate: Members of the community are considerate of their peers — other R users. We’re thoughtful when addressing the efforts of others, keeping in mind that oftentimes the labor was completed simply for the good of the community. We’re attentive in our communications, whether in person or online, and we’re tactful when approaching differing views.
Respectful: Members of the community are respectful. We’re respectful of others, their positions, their skills, their commitments, and their efforts. We’re respectful of the volunteer efforts that permeate the R community. We’re respectful of the processes set forth in the community, and we work within them. When we disagree, we are courteous in raising our issues.
Overall, we’re good to each other. We contribute to this community not because we have to, but because we want to. If we remember that, these guidelines will come naturally.
Course Philosophy
Analysis of data helps us make better decisions. And computers have accelerated how much data we can analyze.
We can do data analysis using GUI (Graphical User Interface) tools, such as Excel or Tableau. But using a programming language to write code that generates your analysis will make you more efficient and effective, open up a universe of additional functionality, and make your analysis workflow:
reproducible and auditable,
accurate, and
collaborative.
The emphasis in this course will be on analytic methods, coding concepts, and programming practice that are universal; you will be able to apply them in whatever analytic setting you find yourself, and are independent of the tool you’ll be using.
By the end of this course, you will see the relationship between your raw data and the table, plot, or model you want to create, and use a variety of functions to achieve that transformation.
In this course we will be primarily using the open source programming language R, with a tangent into data analysis coding in Python.
Here’s another course description, one that I really like, so (with the author’s permission) I am including it here:
Over the last decade there has been a revolution in statistical and scientific computing. Open source languages like R and Python have overtaken older (and expensive!) corporate software packages like SAS and SPSS, and there are now thousands of books and blog posts and other online resources with excellent tutorials about how to analyze pretty much any kind of data.
This class will expose you to R—one of the most popular, sought-after, and in-demand statistical programming languages. Armed with the foundation of R skills you’ll learn in this class, you’ll know enough to be able to find how to analyze any sort of data-based question in the future.
(from the Syllabus to PMAP 8521: Program Evaluation for Public Service, Andrew Heiss, Georgia State University)
Modern tools
I don’t believe there is any benefit in learning things “the hard way” or “the way I learned it”. In this course we use much better technology that will allow you to do better data analysis more quickly than was possible when I started down this path.
Run your race
One more thing: each person who takes this course comes from a different background. Some may have previous coding experience. Others may be working in data analysis. Some may have a bit of both, and others may have neither.
Here’s some wisdom from Dr. Nicki Washington:
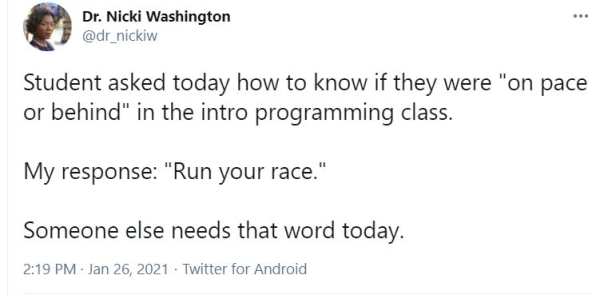
If you stop along the way to check your progress, don’t look at where others are on their race—look at how you’ve moved forward.
Below is the course scatter plot, which has “data analytics” on the Y axis, and “coding fundamentals” on the X axis. Think about where you are today. Wherever you are on the course scatter plot now, you are going to move up on the “data analytics” axis, and right on the “coding fundamentals” axis.
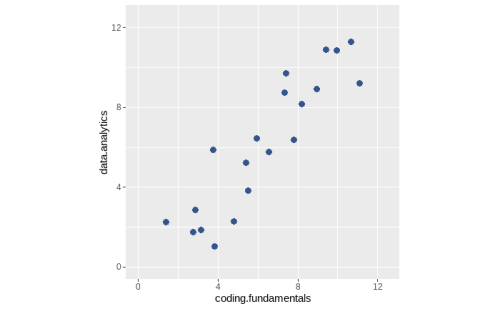
As well, even if both of these topics are new to you, you already know things that are going to help you along the way.
And you are not taking this journey alone! In this course, we collaborate and share things we have worked out—this helps our colleagues, and also helps us remember and solidify what we have learned.
On learning a new language
“Smart people ask stupid questions.” (Source unknown)
Any language, computer or human, can be a challenge to learn. We bring our established ways of thinking, and another language won’t always conform to those ideas. For example, French has gendered nouns—for example, le pot (pot or drink) and la peau (skin)—and English does not. For an English-speaker, this can be frustrating!
One of the most important developers of R packages (and co-author of our textbook), Hadley Wickham, was recently quoted in an interview:
It’s easy when you start out programming to get really frustrated and think, “Oh it’s me, I’m really stupid,” or, “I’m not made out to program.” But, that is absolutely not the case. Everyone gets frustrated. I still get frustrated occasionally when writing R code. It’s just a natural part of programming. So, it happens to everyone and gets less and less over time. Don’t blame yourself. Just take a break, do something fun, and then come back and try again later.
Source: Advice to Young (and Old) Programmers: A Conversation with Hadley Wickham, at R-posts.com
Some advice from people who took DAMS302/BIDA302 before…
People who have previously taken this course were asked “Imagine that time travel is possible…You have just been transported back in time to the day before this course started. What is one thing you would tell your past self about this course?” Here are some of their answers:
It won’t be as scary as you think it will be.
It is fun! Keep up!
You’ll get better soon.
Need to spend more time studying since 1-2 hours a week outside class won’t be enough for a dinosaur like me.
To do the homework on Saturday* after class so you haven’t forgotten everything!
-
Reading the textbook will help you, use it.
Review the data before starting to work with it. It helps to understand what the data is, how it might be used.
Review the material in the Saturday* lesson as you will need it for the assignment.
If you start having to use functions you aren’t familiar with, you’re on the wrong track.
Keep it simple, and then add on as you go.
Be confident in yourself and make sure you read the textbook!
-
The learning curve is the steepest on day one! Just because you’ve never programmed before doesn’t mean you are a lost cause and won’t be able to succeed. Take a deep breath, experiment, and revel in the feeling of satisfaction and accomplishment when R finally executes your code and doesn’t spit out another error message!
P.S. Googling the Error Message may not be a real book, but Google will definitely offer up helpful message boards and YouTube tutorials from friendly members of the R community.
P.P.S. Start an R Notebook and work out the problems in the R for Data Science textbook as you read the relevant chapters. Practice is the best way to learn programming.
I would advise myself that is no necessary to search Google for functions that we haven’t seen in class yet. All assignments can be solved with the information seen in class, it is only necessary to review the lesson files again. So calm down!
Prepare to learn lots about R and RStudio. …And bring coffee!
Structure
The course book’s layout is in 6 sections, each corresponding to the 6 units of the course. Each unit has multiple chapters, corresponding with the topics covered and (when appropriate) the assignment for that unit.
Some important details
Acknowledgements
The authors would like to acknowledge everyone who has contributed to the books, articles, blog posts, and R packages cited within. And of course, all of the participants in DAMS302 who have asked great questions and helped us get better at explaining the why and what of data analysis using R.
License

This work by Martin Monkman & Julie Hawkins is licensed under a Creative Commons Attribution-ShareAlike 4.0 International (CC BY-SA 4.0) License.
Source code
The source code for this ebook can be found at this github repository: https://github.com/MonkmanMH/UVic_DAMS302
This book is written in Markdown, using the bookdown package, and published to the web at bookdown.org.
install.packages("bookdown")
# or the development version
# devtools::install_github("rstudio/bookdown")
Cover image
The course hex image was created using the {hexSticker} R package by Guangchuang Yu.