5.1 Case study: The Challenger disaster
The Challenger disaster occurred on the 28th January of 1986, when the NASA Space Shuttle orbiter Challenger broke apart and disintegrated at 73 seconds into its flight, leading to the deaths of its seven crew members. The accident had serious consequences for the NASA credibility and resulted in an interruption of 32 months in the shuttle program. The Presidential Rogers Commission (formed by astronaut Neil A. Armstrong and Nobel laureate Richard P. Feynman,143 among others) was created in order to investigate the causes of the disaster.
Figure 5.2: Challenger launch and posterior explosion, as broadcasted live by NBC in 28/01/1986. Video also available here.
The Rogers Commission elaborated a report (Presidential Commission on the Space Shuttle Challenger Accident 1986) with all the findings. The commission determined that the disintegration began with the failure of an O-ring seal in the solid rocket booster due to the unusually cold temperature (\(-0.6\) Celsius degrees; \(30.92\) Fahrenheit degrees) during the launch. This failure produced a breach of burning gas through the solid rocket booster that compromised the whole shuttle structure, resulting in its disintegration due to the extreme aerodynamic forces.
The problem with O-rings was something known. The night before the launch, there was a three-hour teleconference between rocket engineers at Thiokol, the manufacturer company of the solid rocket boosters, and NASA. In the teleconference it was discussed the effect on the O-rings performance of the low temperature forecasted for the launch, and eventually a launch decision was attained.144 Figure 5.3a influenced the data analysis conclusion that sustained the launch decision:
“Temperature data [is] not conclusive on predicting primary O-ring blowby.”
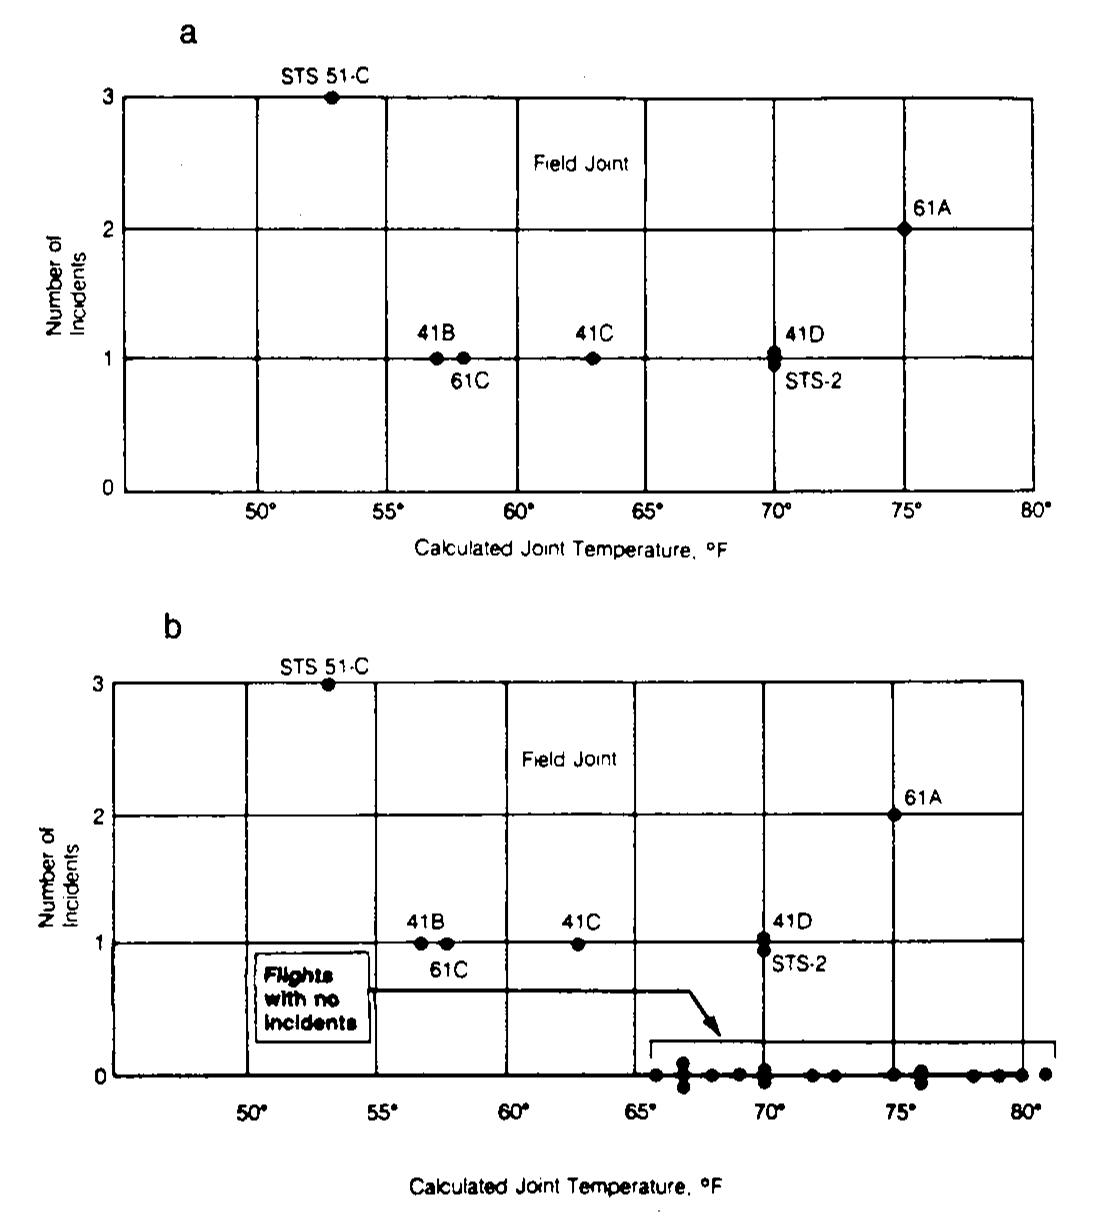
Figure 5.3: Number of incidents in the O-rings (filed joints) versus temperatures. Panel a includes only flights with incidents. Panel b contains all flights (with and without incidents).
The Rogers Commission noted a major flaw in Figure 5.3a, the one presented by the solid rocket booster engineers at the teleconference: the flights with zero incidents were excluded from the plot by the engineers because it was felt that these flights did not contribute any information about the temperature effect (Figure 5.3b). The Rogers Commission therefore concluded:
“A careful analysis of the flight history of O-ring performance would have revealed the correlation of O-ring damage in low temperature”.
The purpose of this case study, inspired by Siddhartha, Fowlkes, and Hoadley (1989), is to quantify what was the influence of the temperature on the probability of having at least one incident related with the O-rings. Specifically, we want to address the following questions:
- Q1. Is the temperature associated with O-ring incidents?
- Q2. In which way was the temperature affecting the probability of O-ring incidents?
- Q3. What was the predicted probability of an incident in an O-ring for the temperature of the launch day?
- Q4. What was the predicted maximum probability of an incident in an O-ring if the launch were postponed until the temperature was above \(11.67\) degrees Celsius, as the vice president of engineers of Thiokol recommended?
To try to answer these questions, we analyze the challenger dataset (download), partially collected in Table 5.1. The dataset contains information regarding the state of the solid rocket boosters after launch145 for \(23\) flights prior the Challenger launch. Each row has, among others, the following variables:
fail.field,fail.nozzle: binary variables indicating whether there was an incident with the O-rings in the field joints or in the nozzles of the solid rocket boosters.1codifies an incident and0its absence. For the analysis, we focus on the O-rings of the field joint as those were the most determinants for the accident.nfail.field,nfail.nozzle: number of incidents with the O-rings in the field joints and in the nozzles.temp: temperature in the day of launch, measured in Celsius degrees.pres.field,pres.nozzle: leak-check pressure tests of the O-rings. These tests assured that the rings would seal the joint.
| flight | date | nfails.field | nfails.nozzle | fail.field | fail.nozzle | temp |
|---|---|---|---|---|---|---|
| 1 | 12/04/81 | 0 | 0 | 0 | 0 | 18.9 |
| 2 | 12/11/81 | 1 | 0 | 1 | 0 | 21.1 |
| 3 | 22/03/82 | 0 | 0 | 0 | 0 | 20.6 |
| 5 | 11/11/82 | 0 | 0 | 0 | 0 | 20.0 |
| 6 | 04/04/83 | 0 | 2 | 0 | 1 | 19.4 |
| 7 | 18/06/83 | 0 | 0 | 0 | 0 | 22.2 |
| 8 | 30/08/83 | 0 | 0 | 0 | 0 | 22.8 |
| 9 | 28/11/83 | 0 | 0 | 0 | 0 | 21.1 |
| 41-B | 03/02/84 | 1 | 1 | 1 | 1 | 13.9 |
| 41-C | 06/04/84 | 1 | 1 | 1 | 1 | 17.2 |
| 41-D | 30/08/84 | 1 | 1 | 1 | 1 | 21.1 |
| 41-G | 05/10/84 | 0 | 0 | 0 | 0 | 25.6 |
| 51-A | 08/11/84 | 0 | 0 | 0 | 0 | 19.4 |
| 51-C | 24/01/85 | 2 | 2 | 1 | 1 | 11.7 |
| 51-D | 12/04/85 | 0 | 2 | 0 | 1 | 19.4 |
| 51-B | 29/04/85 | 0 | 2 | 0 | 1 | 23.9 |
| 51-G | 17/06/85 | 0 | 2 | 0 | 1 | 21.1 |
| 51-F | 29/07/85 | 0 | 0 | 0 | 0 | 27.2 |
| 51-I | 27/08/85 | 0 | 0 | 0 | 0 | 24.4 |
| 51-J | 03/10/85 | 0 | 0 | 0 | 0 | 26.1 |
| 61-A | 30/10/85 | 2 | 0 | 1 | 0 | 23.9 |
| 61-B | 26/11/85 | 0 | 2 | 0 | 1 | 24.4 |
| 61-C | 12/01/86 | 1 | 2 | 1 | 1 | 14.4 |
Let’s begin the analysis by replicating Figures 5.3a and 5.3b, and by checking that linear regression is not the right tool for addressing Q1–Q4.
# Figures 5.3a and 5.3b
car::scatterplot(nfails.field ~ temp, smooth = FALSE, boxplots = FALSE,
                 data = challenger, subset = nfails.field > 0)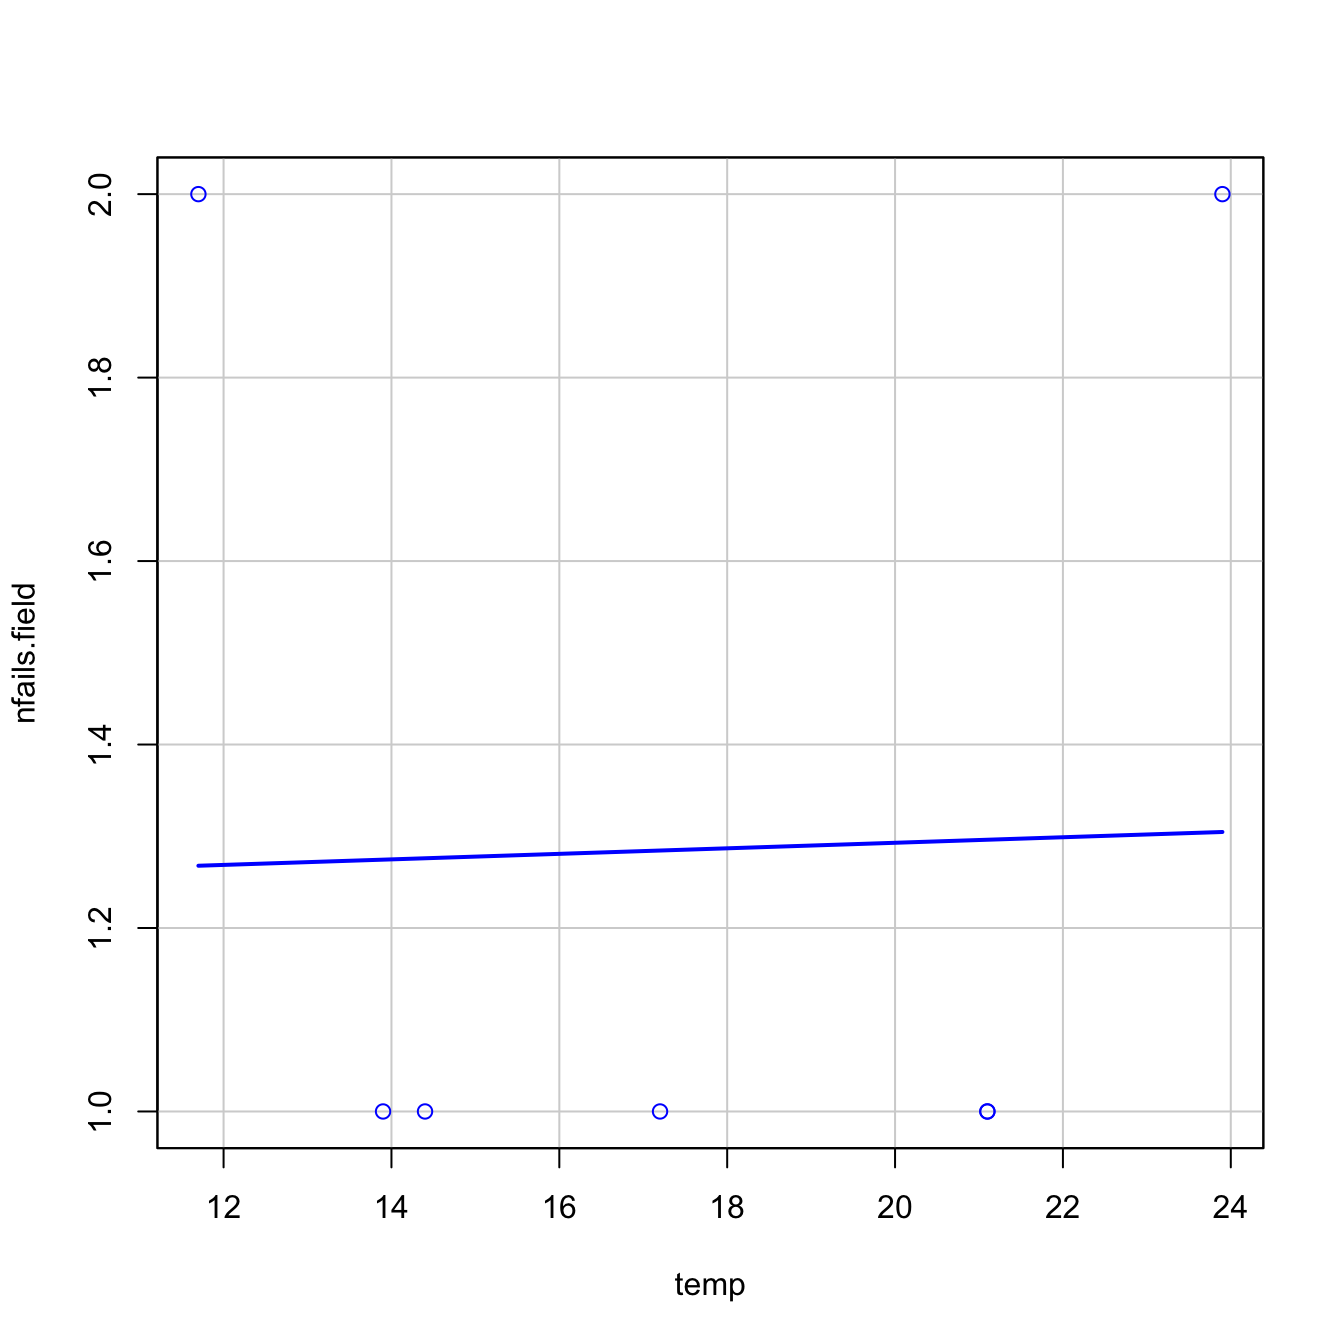
There is a fundamental problem in using linear regression for this data: the response is not continuous. As a consequence, there is no linearity and the errors around the mean are not normal (indeed, they are strongly non-normal). Let’s check this with the corresponding diagnostic plots:
# Fit linear model, and run linearity and normality diagnostics
mod <- lm(nfails.field ~ temp, data = challenger)
plot(mod, 1)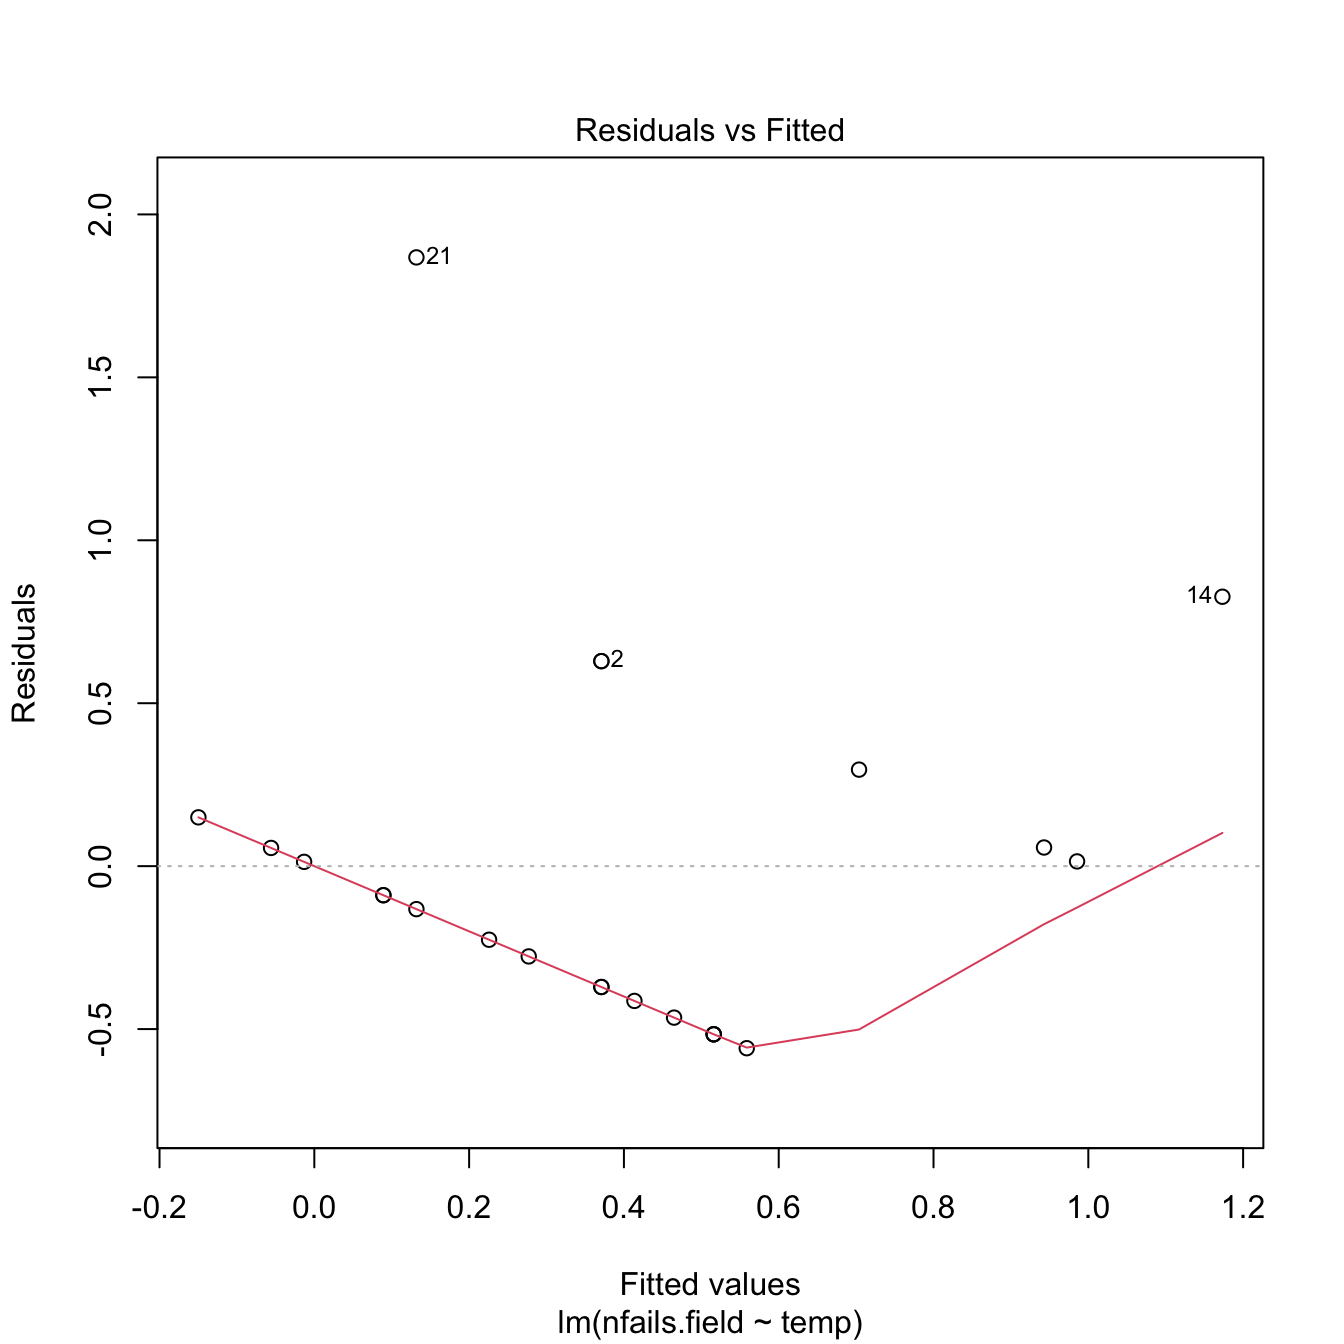

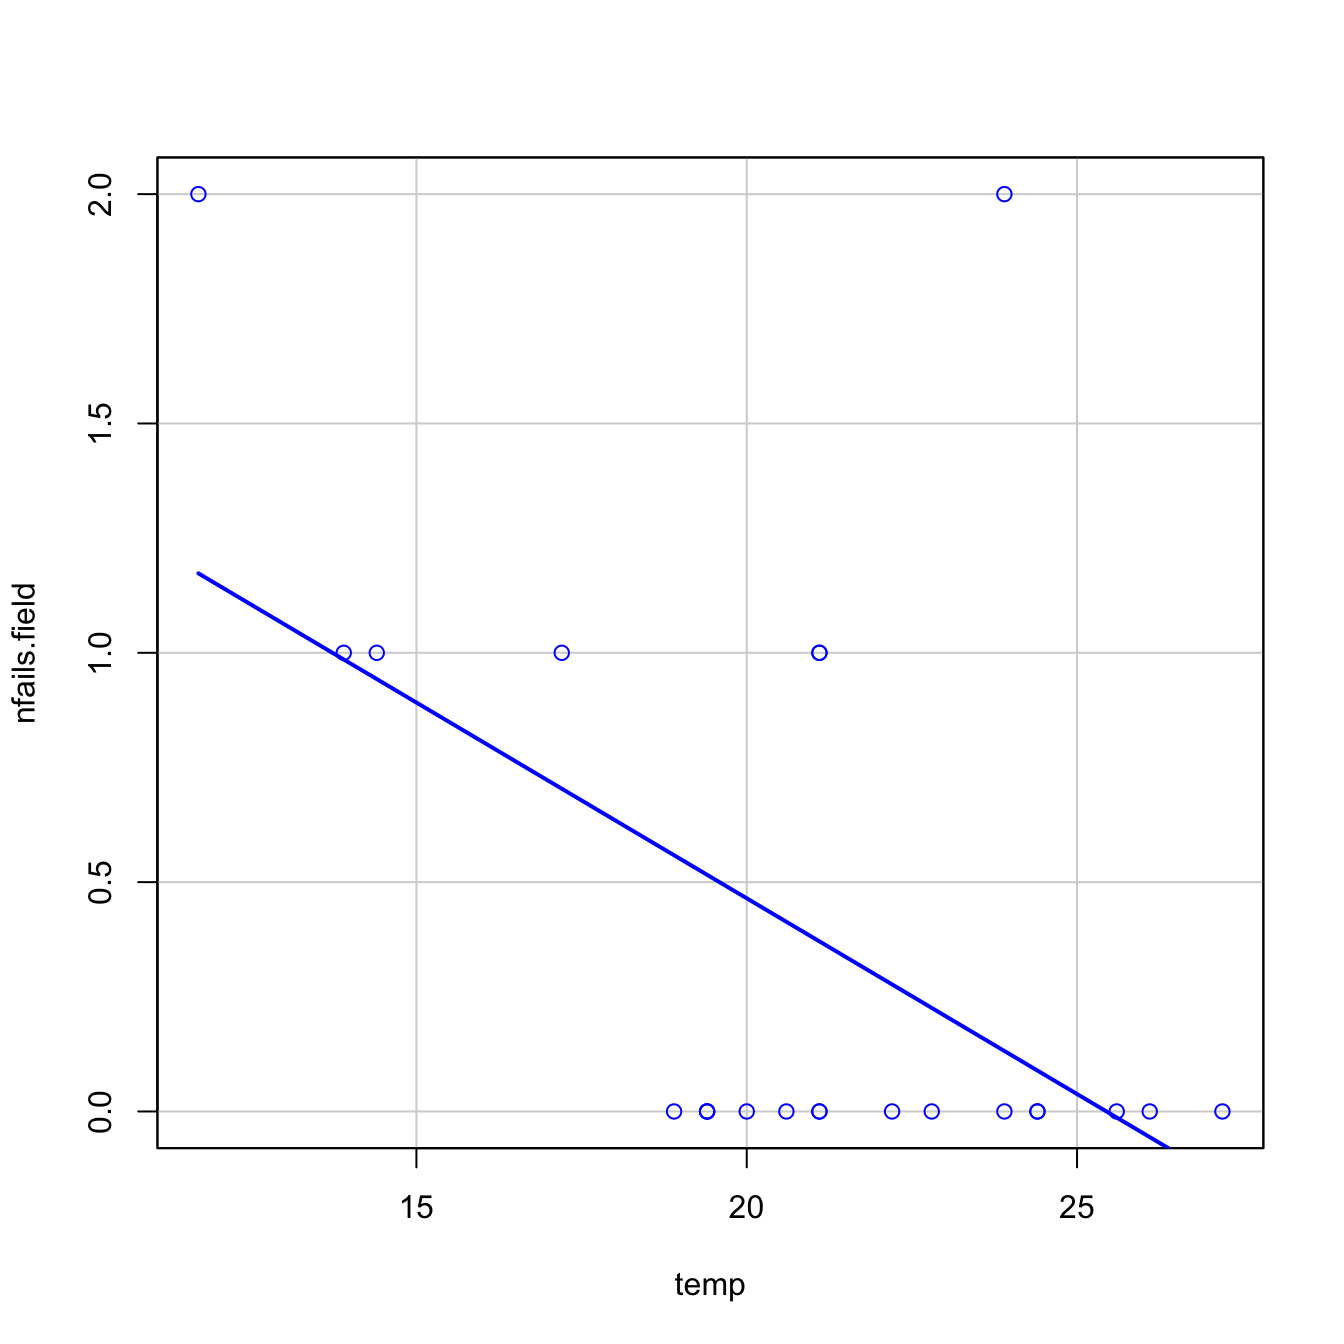
Despite linear regression is not the adequate tool for this data, it is able to detect the obvious difference between the two plots:
- The trend for launches with incidents is flat, hence suggesting there is no correlation on the temperature (Figure 5.3a). This was one of the arguments behind NASA’s decision of launching the rocket at a temperature of \(-0.6\) Celsius degrees.
- However, as Figure 5.3b reveals, the trend for all launches indicates a clear negative dependence between temperature and number of incidents! Think about it in this way: the minimum temperature for a launch without incidents ever recorded was above \(18\) Celsius degrees, and the Challenger was launched at \(-0.6\) without clearly knowing the effects of such low temperatures.
Along this chapter we will see the required tools for answering precisely Q1–Q4.
References
His Appendix F in the Rogers Commission is particularly critical on the increasing sequence of risks that NASA took previously to the Challenger disaster. His closing sentence: “For a successful technology, reality must take precedence over public relations, for nature cannot be fooled”.↩︎
Episode S1:E3 “A Major Malfunction” in Netflix’s series “Challenger: The Final Flight” reproduces the events during this teleconference between Thiokol (Promontory, Utah) and NASA (Cape Canaveral, Florida), with interviews to the relevant actors. The covering of the teleconference spans from the time marks 17:40 to 23:55. Relevant highlights are: the engineers are told to give an assessment of concerns regarding launching in cold weather (17:40–18:56); the engineers present the report and their unquantified concerns about higher risk with cold temperatures (20:38–21:20); Larry Mulloy, NASA manager in 1986, says “The data [the engineers presented] did not support the recommendation that the engineers were making. The data was totally inconclusive.” (21:47–21:58); the vice president of engineers of Thiokol, Robert Lund, gives the specific recommendation to not launch below \(53\) degrees Fahrenheit (\(11.67\) degrees Celsius) and Larry Mulloy replies (22:33–22:53); Robert Lund, pressured, changes his assessment and agrees with Larry Mulloy’s: data is inconclusive (24:12–25:33). Recall that the data presented during the teleconference is the one summarized in Figure 5.3a.↩︎
After the shuttle exits the atmosphere, the solid rocket boosters separate and descend to land using a parachute. After recovery, they are carefully analyzed.↩︎