Chapter 26 Kruskal-Wallis H test
If the assumptions of the one-way ANOVA are violated, then we can consider using a Kruskal-Wallis test. The Kruskal-Wallis test is essentially an extension of the Mann-Whitney U test from Section 22.5.2 for samples with more than two groups (Kruskal & Wallis, 1952). Like the Mann-Whitney U test, it uses the ranks of values instead of the actual values in the dataset. The idea is to rank all values in the dataset, ignoring group, then calculate a test statistic (\(H\)) that increases as the difference among group ranks increases, relative to the difference within group ranks. We can again use the example of the fig wasp wing lengths introduced in Chapter 24. For convenience, Table 24.1 is reproduced here as Table 26.1.
| Het1 | Het2 | LO1 | SO1 | SO2 |
|---|---|---|---|---|
| 2.122 | 1.810 | 1.869 | 1.557 | 1.635 |
| 1.938 | 1.821 | 1.957 | 1.493 | 1.700 |
| 1.765 | 1.653 | 1.589 | 1.470 | 1.407 |
| 1.700 | 1.547 | 1.430 | 1.541 | 1.378 |
Recall that in the one-way ANOVA from Section 24.2, we reject the null hypothesis that all species had the same mean wing length (\(P = 0.042\)). But we had not actually tested the assumptions of the one-way ANOVA before running the test! If we had tested the ANOVA assumptions, we would not reject the null hypothesis that wing length is normally distributed (Shapiro-Wilk test \(P = 0.698\)). But a Levene’s test of homogeneity of variances convincingly rejects the null hypothesis that the group variances are equal (\(P = 0.008\)). Consequently, we should probably have considered the non-parametric Kruskal-Wallis H test instead. To do this, we first need to rank all of the values in Table 26.1. There are 20 total values, so we rank them from 1 to 20 (Table 26.2).
| Het1 | Het2 | LO1 | SO1 | SO2 |
|---|---|---|---|---|
| 20 | 15 | 17 | 8 | 10 |
| 18 | 16 | 19 | 5 | 12.5 |
| 14 | 11 | 9 | 4 | 2 |
| 12.5 | 7 | 3 | 6 | 1 |
From these ranks, we calculate a test statistic \(H\) from the overall sample size (N), the sample size (\(N_{i}\)) of each of the groups (\(g\)), the mean of group ranks (\(\bar{R}_{i}\)), and the overall mean rank (\(\bar{\bar R}\)). Of course, we do not need to do this by hand. But the formula shows how a statistical program will do the calculation (Kruskal, 1952),
\[H = (N - 1) \frac{\sum_{i=1}^{g}N_{i}\left(\bar{R}_{i} - \bar{\bar R} \right)^2}{\sum_{i=1}^{g}\sum_{j=1}^{N_{i}} \left(R_{ij} - \bar{\bar R} \right)^{2}}.\]
For our purposes, the mathematical details are not important. The equation is included here only to show the similarity between the calculation of \(H\) versus \(F\) from Section 24.2. In the numerator of the equation for \(H\), we are calculating the squared deviation of mean group ranks from the overall mean rank \((\bar{R}_{i} - \bar{\bar R})^2\), as weighted by the group sample size \(N_{i}\). We are then dividing by the sum of squared deviations of all ranks (\(R_{ij}\)) from the overall mean rank \(\bar{\bar R}\). All of this gets multiplied by \(N - 1\) to give the test statistic \(H\). We can then compare \(H\) to a suitable null distribution, which might be calculated precisely using a specific algorithm (e.g., Choi et al., 2003). But most statistical programs such as jamovi compare \(H\) to a Chi-square distribution (see Chapter 29), which is an effective approximation (Miller & Miller, 2004).
The output of a Kruskal-Wallis H test is quite minimal and easy to read. Jamovi reports a Chi-square (\(\chi^{2}\)) test statistic, degrees of freedom, and p-value (The jamovi project, 2024). Figure 26.1 shows the output of a Kruskal-Wallis H test on the fig wasp wing lengths data.
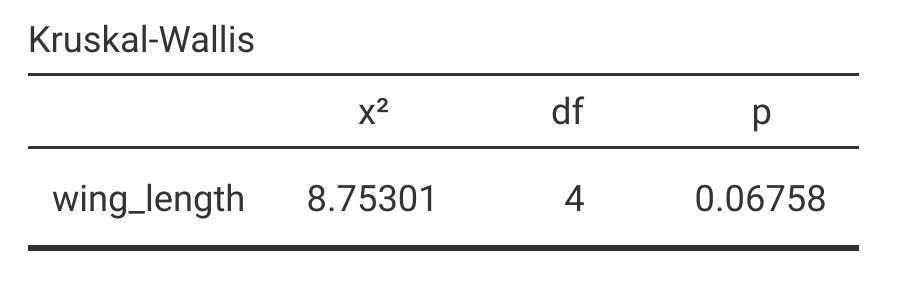
Figure 26.1: Jamovi output table for a non-parametric Kruskal-Wallis H test, which tests the null hypothesis that species mean wing lengths are the same for five different species of fig wasps. Species wing length measurements were collected in 2010 near La Paz in Baja, Mexico.
Given the Kruskal-Wallis H test output (Figure 26.1), we should not reject the null hypothesis that species have different wing lengths because \(P > 0.05\). This is in contrast to our one-way ANOVA result, for which we did reject the same null hypothesis. The Kruskal-Wallis H test does not assume that group variances are the same, unlike the one-way ANOVA. Since we know that the homogeneity of variances assumption is violated for the fig wasp data, it is probably best to be cautious and conclude that there is no evidence that mean wing lengths differ among species.