1.4 Depressions
Understanding depressions requires an appreciation for the 3-dimensional structure of the atmosphere. However, on synoptic weather charts, we only see the isobars (lines of equal pressure) and fronts as they are at the surface of the earth. In this description, 3D illustrations are shown next to a schematic of a synoptic chart.
We begin by taking a closer look at the polar front - the boundary between the cold air coming from the Arctic and the warmer air from the south. Because the warm air mass is less dense than the colder one, the front is not vertical - the warm air mass tends to lie over the colder.
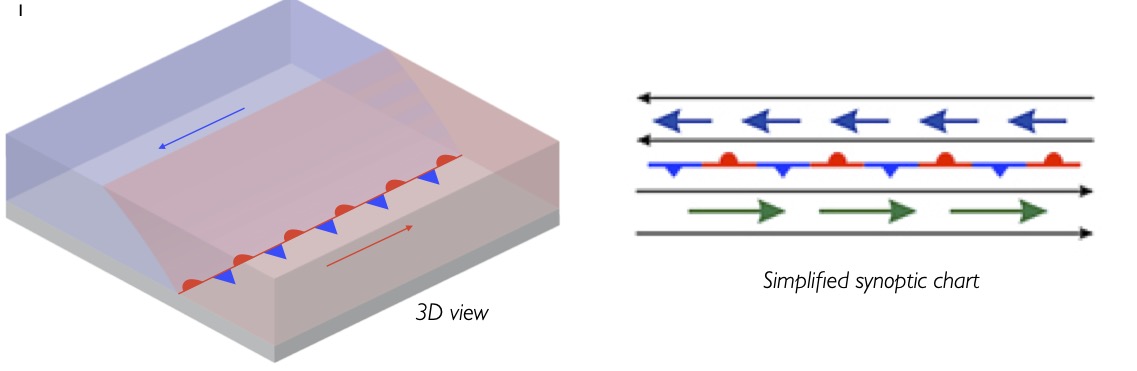
The polar front is not a very stable situation - the warm air can tend to float over the cooler, and the jet stream wind blowing above can draw air in and up. Disturbances along the polar front cause the warm air from the mid-latitude cell to intrude into the colder air mass to the north.The rising air causes a reduction in surface pressure, causing wind. The low pressure draws in more warm air from the south, causing the area of low pressure to deepen. Because the earth is rotating, air does not blow directly in towards low pressure areas, but instead spirals in anticlockwise, rather like water down a plughole.
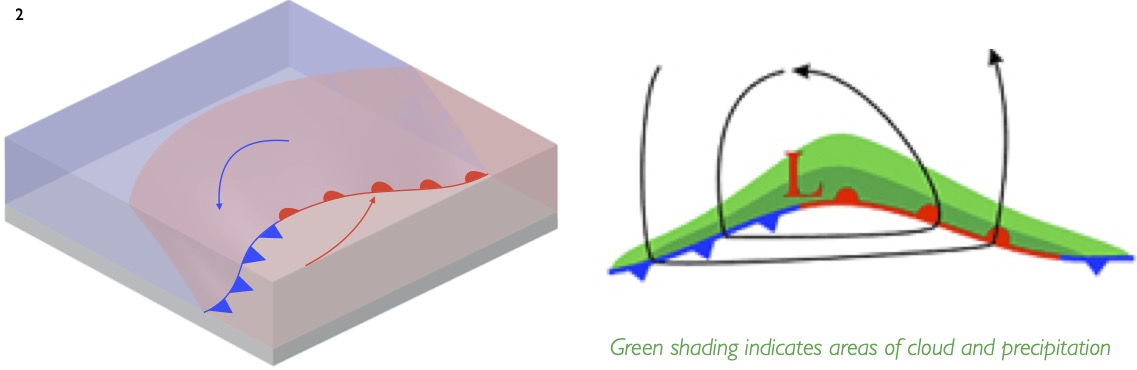
These processes become self-sustaining.The warm air rises, creating low pressure, drawing in yet more warm and wet air from the south. Pressure drops and a circulation of wind starts to develop around the disturbance in the polar front. At this stage the depression is known as an early-stage or wave-type low.
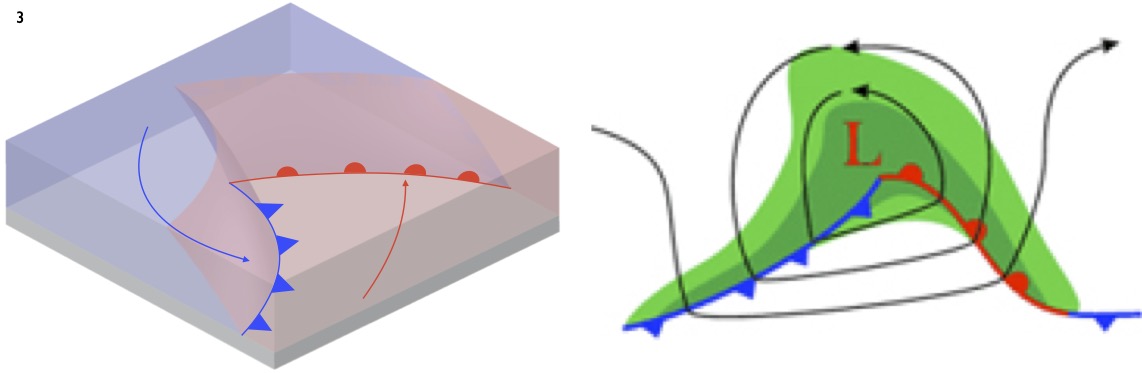
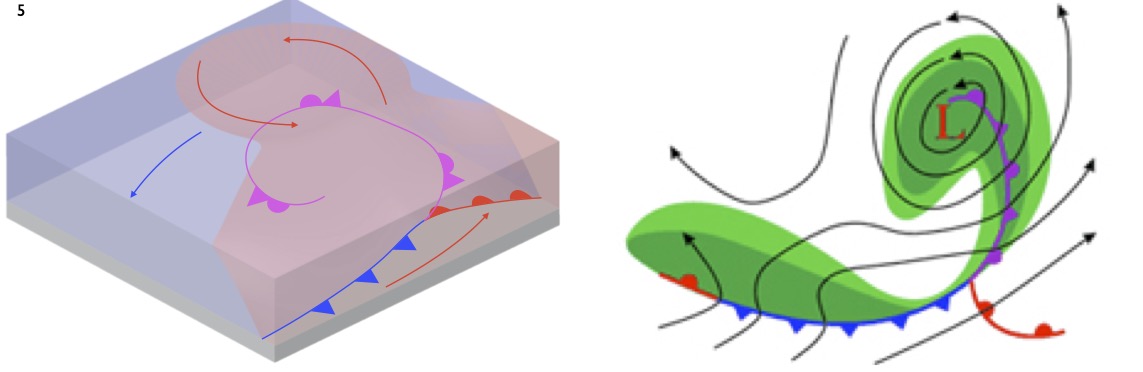
As the low develops, a wedge shaped area of warm air, known as the warm sector, develops. The depression is now fully developed, and significant winds are now blowing anticlockwise around the low pressure area.The boundaries between the warm sector and the colder air are known as ‘fronts’ and are named after the air behind them.The ‘warm front’ at the front of the warm sector has warm air behind, whilst the ‘cold front’ at the back has cold air behind it. Warm fronts are depicted with semicircles and sometimes shown in red. Cold fronts are marked by triangles and shown in blue
Further movement of the warm sector over the cold air mass causes some of the warm air to be lifted entirely off the ground.This is know as ‘occlusion’. On synoptic charts, an occluded front is drawn under this elevated warm air. It is marked with both semicircles and triangles and sometimes shown in purple. Once occlusion occurs, the depression will typically not reduce in pressure much further.
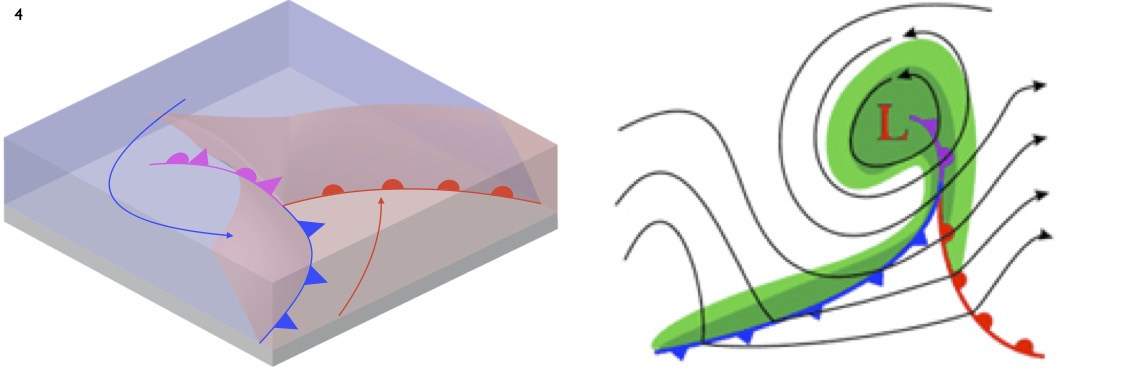
As occlusion continues,the system is cut off from the supply of further warm air and moisture from the south. As such, the depression cannot develop further and now starts to dissipate.
Synoptic diagrams from the COMET® Website at http://meted.ucar.edu/ of the University Corporation for Atmospheric Research (UCAR), sponsored in part through cooperative agreement(s) with the National Oceanic and Atmospheric Administration (NOAA), U.S. Department of Commerce (DOC). ©1997-2016 University Corporation for Atmospheric Research.All Rights Reserved.