2.7 Tidal diamonds
On charts, tidal information is given at specific points denoted by a purple diamond shape with a letter. A table, normally found at a corner of the chart, gives information on the tidal flow at each point.
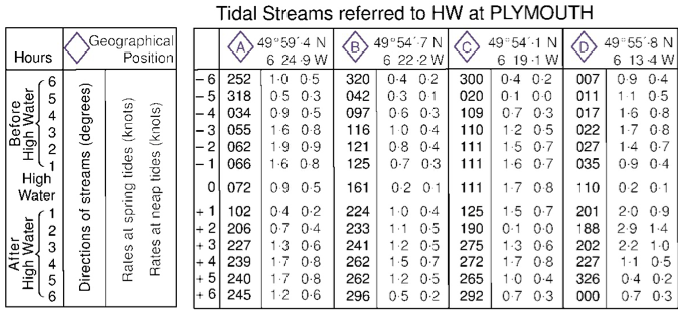
The chart extracts below show Saint Mary’s Sound in the Scillies and the corresponding data table. The information is laid out in a fairly self-explanatory way:
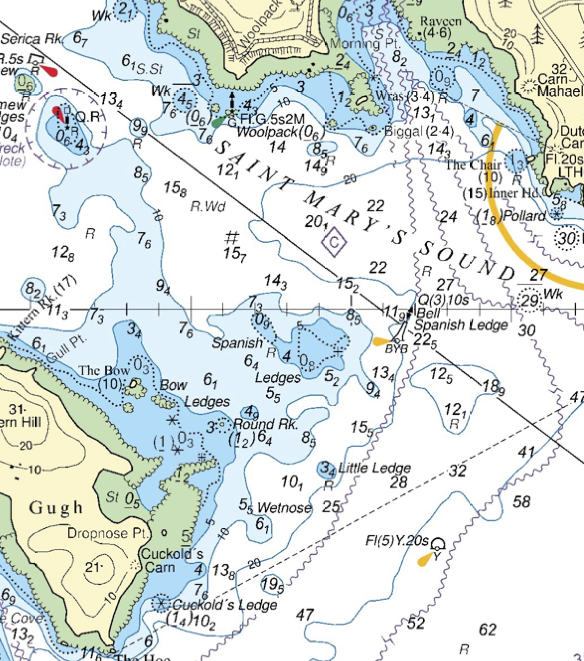
Describe the tidal flow in Saint Mary’s Sound on July 4th 2017? We notice that the tidal stream tables refer to high water at Plymouth. We must begin by consulting a Plymouth tide table:
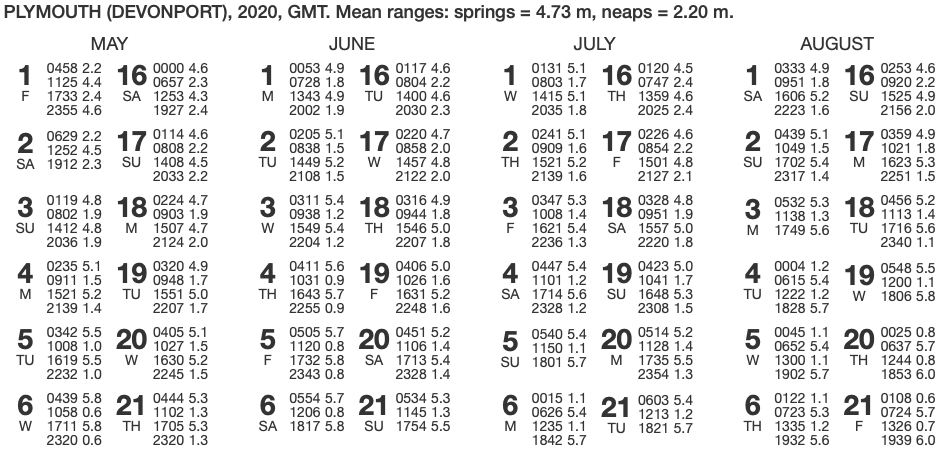
On July 4th, we have the following times of high and low water, remembering to add the hour for British Summer time:
05:47 5.4 m High Water
12:01 1.2 m Low Water
18:14 5.6 m High Water
We note that the tidal range is 4.4 m, and the factor is 4.4/4.73 = 93%, which is close to springs. We will use the left hand column for diamond C which gives the rates at spring tides.
The table below shows data taken from tidal diamond C related to times on June 14. It has been created by entering the HW times for Plymouth on the ‘0’ row then counting backward and forward up and down the table:
| Time relative to HW | Bearing | Time of day | Rate | Comment |
|---|---|---|---|---|
| -6 | 300 | 12:14 | 0.4 kt | |
| -5 | 20 | 13:14 | 0.1 kt | Tide is turning to the east |
| -4 | 109 | 14:14 | 0.7 kt | |
| -3 | 110 | 15:14 | 1.2 kt | |
| -2 | 111 | 16:14 | 1.5 kt | |
| -1 | 111 | 17:14 | 1.6 kt | |
| 0 | 111 | 05:47 , 18:14 | 1.7 kt | Tide runs at maximum speed east |
| +1 | 125 | 06:47 | 1.5 kt | |
| +2 | 190 | 07:47 | 0.1 kt | Tide is turning to the west |
| +3 | 275 | 08:47 | 1.3 kt | |
| +4 | 272 | 09:47 | 1.7 kt | Tide runs west at maximum rate |
| +5 | 265 | 10:47 | 1.0 kt | |
| +6 | 292 | 11:47 | 0.7 kt |
So, the tide starts flowing west a little after 07:47 in the morning. At around 09:47, it reaches a maximum speed in the westward direction of 1.7 knots. The speed drops until around 13:14, when the tide swings to the north, before starting to run east. It reaches the maximum speed eastward of 1.7 knots at around 18:14 in the evening.
Note the approximate times given – we only have data at each hour, so we can only estimate the times of slack water and maximum flow.