1.3 Other considerations
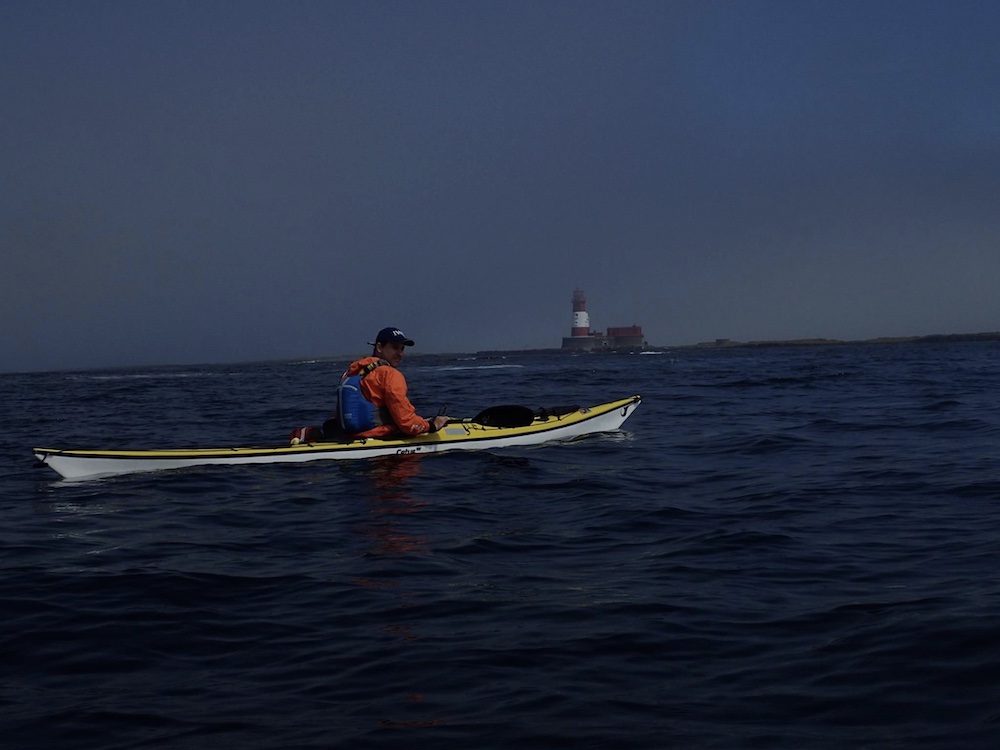
1.3.1 Visibility
Visibility is simply a measure of how far you can see. On a clear day, you might be able to see about 3 miles, or much further if you climb a hill. In thick fog, visibility might drop below 20 meters.
Visibility information is available in weather forecasts, and many will use special symbols for mist or fog. The table below gives the descriptions used by the UK Met Office:
| Description | Distance at which objects can be clearly seen in kilometres |
|---|---|
| VP (Very poor) | <1 |
| P (Poor) | 1-4 |
| M (Moderate) | 4-10 |
| G (Good) | 10-20 |
| VG (Very good) | 20-40 |
| E (Excellent) | >40 |
1.3.2 Fog
Two types of fog can form over the sea:
- Advection fog is caused by moist air moving over cold water. It is most common in Spring and early Summer. It forms in light winds - anything more than 15 knots tends to lift the fog from the surface. It can come in suddenly and persist for long periods.
- Radiation fog is caused by the land cooling during the night. Although it is formed over land, it can drift over the sea. This fog is more common in Autumn and Winter, although it can form on colder mornings at other times of year. Once over the sea, it tends to disperse.
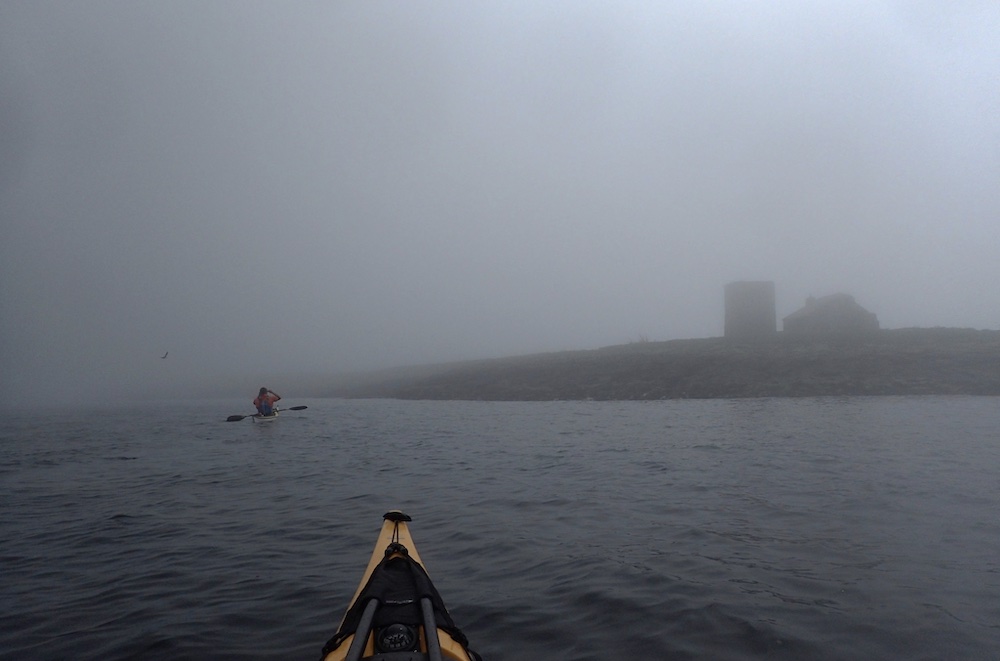
Fog prevents an obvious challenge if the group’s navigation skills are imperfect - it’s too easy to become disorientated. There’s also a danger of collisions with other craft, especially if you’re paddling in busy areas like harbors or shipping lanes. Be aware that fog is a persistent and somewhat unpredictable occurrence in some parts of the world at certain times of year. For example, between between April and September, warm air passing over the cold North Sea often produces a thick sea fog called the ‘Haar’, which can roll in rapidly to the UK’s north eastern coastlines with a slight sea breeze.
1.3.3 Thunderstorms
Thunderstorms present dangers to a paddling group that can’t be mitigated by tactics or better skills. Apart from the serious risk of a lightning strike, thunderstorms bring strong wind squalls and reduced visibility. If thunderstorms are forecast (they’re typically shown by a cloud symbol with a lightning bolt), stay off the water. If you get caught out by an approaching storm, find somewhere to land and seek shelter (although not under isolated trees). If there’s no shelter, crouching down away from the water and your boats and equipment is the safest option.
1.3.4 River levels
River levels vary according to how much rain has fallen over the last few hours. The level of rivers is affected by how heavy the rain has been (e.g. light showers vs. heavy continuous rain - remember the weather forecast symbols) and how long it has been raining for. The dangers posed by paddling on rivers can vary markedly with the river level - slow-moving lazy streams at normal levels can become dangerous fast-flowing torrents when high.
In recent years, accurate information on river levels as become available online. Useful sources include:
https://riverlevels.uk : a site that presents gauge data in context of typical levels.
https://riverpredictor.uk : gives current levels for many UK whitewater runs together with forecasts for the coming hours and days
Apps like ‘RiverApp’ and ‘Rainchasers’
A number of factors affect river levels in somewhat complicated ways. Whilst this is likely to be of less interest to the sea paddler, it is clearly of great relevance to whitewater boaters… although perhaps less now that reliable data and forecasts can be downloaded to your phone. Here’s a brief rundown of some of the main factors:
Rainfall: clearly more rain will bring the rivers up higher and faster. Note that there is likely to be more rain at higher altitude in the headwaters of the river than at lower levels - average annual rainfall increases by 8% for every 30 m height gain over sea level totals.
Time: It takes time for the rain, which is likely falling most on higher ground, to make it into the river. As a result, there will be a lag between the rain starting and the river rising. When the rain stops, the river may continue to rise, and the flow will likely reduce slowly.
Temperature: If it is cold, the rain at high levels may fall as snow, which won’t contribute (immediately at least) to river rises. If there is a frost, river levels are likely to be low in the morning as water is frozen in place.
Infiltration: Some of the water from rain will infiltrate into soils and rock rather than run into rivers. Intense rain may overwhelm the ability of the soil to absorb more water. And ground that is saturated by previous rain wont be able to infiltrate any more - a phenomenon often linked to winter floods.
Snow melt: In some regions of the world, rivers are mostly fed by melting snow and glacial ice in the main paddling season. In these areas, the daily temperature and the amount of winter snow will drive river levels. Rain falling on snow can cause a large amount of melt water to run down quickly, causing rivers to rise rapidly.
Nature of the drainage area: If the drainage area is covered in trees, they will intercept and slow the rain, resulting in slower river rises. If the drainage area is rocky, there may be little infiltration and run off may be rapid.
Area of the drainage: Rivers with a large drainage area tend to rise and fall more slowly compared to those will smaller catchments.
Drainage basin shape: round or compact catchments areas will lead to more rapid runoff than elongated basins.