4.2 Maps and Charts
Sea kayakers use two sorts of maps – normal ‘hiking’ maps (mostly produced by the Ordnance Survey in the UK) and nautical charts.
4.2.1 Comparing maps and charts
For comparison an OS map and a nautical chart of the same area are shown below:
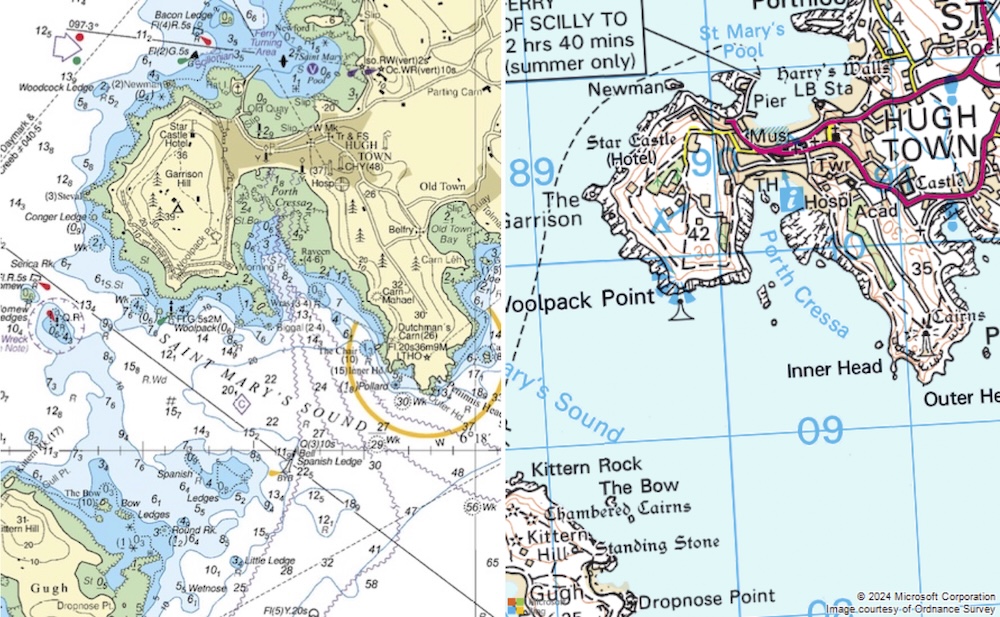
Chart © Crown Copyright and/or database rights. NOT FOR NAVIGATION. Reproduced by permission of the Controller of Her Majesty’s Stationery Office and the UK Hydrographic Office (www.GOV.uk/UKHO). OS map Contains OS data © Crown copyright and database rights.
Notice the difference in emphasis between the maps. The OS map shows great detail on the land, but shows the sea as a uniform blue. By contrast, the chart shows only basic detail of the land (only the features easily identifiable from the sea), but gives much more information about the sea.
The advantages of charts are that they show:
- Details on the depth of the seabed, which is useful in understanding likely conditions and important if falling tides might expose significant areas.
- The positions of buoys and other navigational marks – useful especially for navigation across open water and at night when these are lit.
- Tidal information.
- Greater detail of the exact shape of the coastline and islands, if a large enough scale is available.
However, the chart is useless for navigating on land to find the put in, or in case of an unplanned landing. Also, close in to many coastlines, large-scale OS maps (especially the 1:25,000 series) show many details that can make navigation easier for a kayaker. OS maps are also more readily available than charts.
4.2.2 Reading charts*
Nautical charts use a bewildering array of symbols to convey information. The full list is found in a book ‘Symbols and Abbreviations Used on Admiralty Paper Charts’, also known as ‘Chart 5011’. However, sea kayakers only need to know a small proportion of these symbols.
Land on charts, above springs high water, is colored yellow. Deep sea appears as white, with blue used for shallow areas. Green is used to indicate parts of the seabed that can dry out at low tide, but which are covered at high water on a spring tide.
The numbers that cover a chart are depths. Underlined numbers are drying heights – i.e. how high that place will be above the water at a low tide. Both depths and drying heights are measured with respect to the ‘chart datum’ - generally the level of the lowest possible (astronomical) tide. The chart datum is the same as the zero used for tide tables.
Wiggly lines on charts, looking like waves, are used to indicate areas of rough water. Arrows are used to indicate tidal stream directions. Buoys are illustrated on charts using symbols that look like the shape of the buoy.
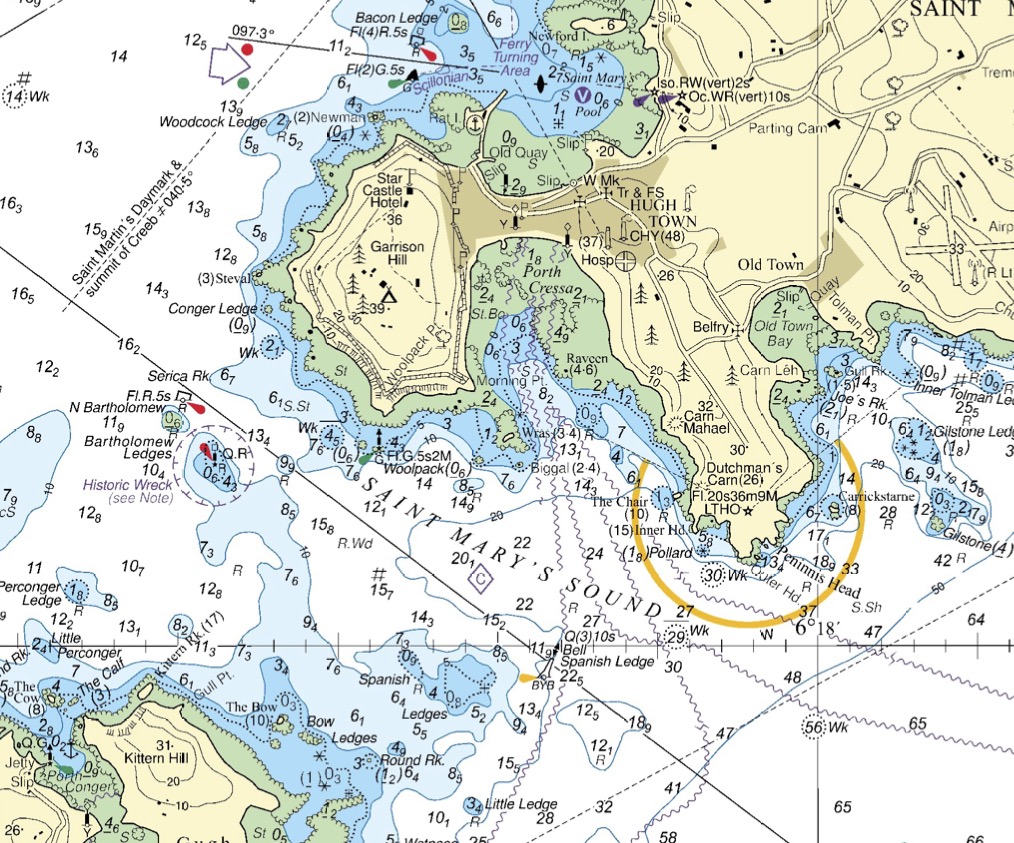
Charts © Crown Copyright and/or database rights. NOT FOR NAVIGATION. Reproduced by permission of the Controller of Her Majesty’s Stationery Office and the UK Hydrographic Office (www.GOV.uk/UKHO)
4.2.3 Which to use?
In practice, I tend to use 1:50,000 OS maps for most simple coastal navigation. I’ll think about using a chart instead when:
- I’ll be leaving the coastline - e.g. paddling between islands, or especially if I’m making an open crossing - tidal information, and marking of buoys becomes useful
- When the available charts for the area contain a lot of information useful to sea kayakers - mostly tidal stream information, or buoys useful for navigation
- When charts are available at useful scales (e.g. 1:50,000 or larger)
- When information on drying heights is useful - i.e. in areas like estuaries or shallow reefs where the area I want to paddle sometimes becomes dry land
- When I don’t need fine detail for navigating along the coastline.
In general, it’s possible to use either OS maps or charts for most purposes, especially if you mark up your OS map with tidal information and the odd useful buoy.
The one occasion when I will always use a chart is when navigating through areas with lots of other boats and large ships (e.g. Portsmouth Harbor, much of The Solent, Firth of Forth). In these places, it’s critical to know where the shipping lanes are and what landmarks harbormasters are referring to over the VHF. Buoys are often numerous and become essential for navigation if you’re doing anything other than hugging a shoreline.
In summary, 1:50,000 ‘Landranger’ OS maps are a great choice for most purposes, and will be totally adequate for sea kayakers undertaking simple coastal journeys away from busy ports.
4.2.4 Obtaining maps and charts
OS maps are widely available from bookshops and online sellers. The 1:50,000 ‘Landranger’ maps are normally adequate for sea kayaking. The 1:25,000 ‘Explorer’ series has more detail, but it’s only useful if you want to navigate with a level of precision that isn’t normally required. Ebay is a good source of second-hand OS maps.
There are some online sources for OS Maps:
Bing maps has an Ordnance Survey mapping option, with both 1:50,000 and 1:25,000 maps if you zoom in. The site has a print button, although the size and quality of the prints isn’t very useful.
Some other sites display OS maps using the OS maps API (e.g. The Hug). The terms of use linked on the map do not permit printing the maps out.
OS Maps is a subscription service that allows you to print OS maps at decent size and quality.
Charts are somewhat more difficult to get hold of. In the UK, charts were traditionally produced by the UK Hydrographic office (UKHO) under the ‘Admiralty’ brand. Whilst the UKHO still produces paper charts, it has announced that it will stop doing so by the end of 2026. Most UKHO charts are rather large, designed for use on large ships. However, the UKHO publishes leisure folios of charts for small craft users which are good value if you want coverage of a large area and contain charts that are a more sensible size for the average coffee table.
VisitMyHarbour is a website intended for sailors which much useful information (e.g. tide tables, tidal stream atlases) for free. For a very modest one-time charge, you can access the entire set of UKHO charts for the UK.
The other major chart producer for the UK is Imray. When the UKHO announced their intention to discontinue paper charts, Imray said that they would continue to produce them for the foreseeable future. However, they decided against this in 2024 and will stop selling paper charts around the end of 2025. Imray does offer a phone and tablet app, but I’ve not found an online source for their charts.
For yachting, it’s considered essential to have fully up-to-date charts - sailors get particularly worried about newly discovered shallow rocks. Whilst things do change on charts, it’s far less critical for sea kayakers to have the most recent versions. This means we can take advantage of yachties selling their old charts secondhand. Ebay is a good source for UKHO and Imray charts.
Digital charts can be viewes on the Navionics app. Whilst the format is a little less familiar, the detail is impressive, especially if you’re interested in depth information.
4.2.5 Other sources of maps
Maps can also be found:
In guidebooks - whilst these aren’t normally good enough to navigate with, they often contain useful additional information (e.g. tidal streams, get ins…) and can be useful for planning discussions
Google - google maps isn’t great for navigation but can be superb for finding get-ins and scoping them out using Streetview.
The Paddle UK Go Paddling website carries a lot of information on places to go paddling around the UK, including the annotated ‘Paddlepoints’ map.