2.3 Tidal streams
In order for the tide to rise and fall at a given location, water must move from one place to another. These horizontal movements of water are known as tidal streams.
In many areas frequented by sea kayakers, steep rocky coastlines make the height of tide less of a concern. However, tidal streams often run at 2-3 kt and sometimes much faster. Given that tidal streams can move as fast as we can paddle, they clearly need to be accounted for in our plans.

We may choose to arrive at areas with fast tidal flows (typically headlands or narrow straits):
At slack water to avoid the tidal flow to increase safety (or perhaps to remain within our leadership remit)
At full flow to maximize the benefit from the tidal stream, and to enjoy crashing through the race waves
As the tide builds, so that we can gain confidence playing in the stream and stop when it gets too much for us.
This map below shows the directions of the main flood tidal streams (i.e. those that occur in the run up to high water at Dover and Liverpool) around the UK. The tidal streams run in the opposite direction during the ‘Ebb’.

Unfortunately, tidal streams do not necessarily change direction at high and low water, so we need to find information on when they turn for the location at which we want to paddle. A range of information sources about tidal streams exist. The main sources are:
- Tidal diamonds (and the associated tables) on charts
- Tidal stream atlases
- Pilots and guidebooks
These sources will give the time that the tide changes relative to some reference port. Note that the reference port used may be some distance from the location - e.g. Dover is used as a reference port by some sources for tidal streams at Lands End.
Each type of source presents the information in a different way, so we’ll consider them one by one in the sections that follow.
2.3.1 Tidal diamonds
On charts, tidal information is given at specific points denoted by a purple diamond shape with a letter. A table, normally found at a corner of the chart, gives information on the tidal flow at each point.
The chart extracts below show Saint Mary’s Sound in the Scillies and the corresponding data table. The information is laid out in a fairly self-explanatory way:
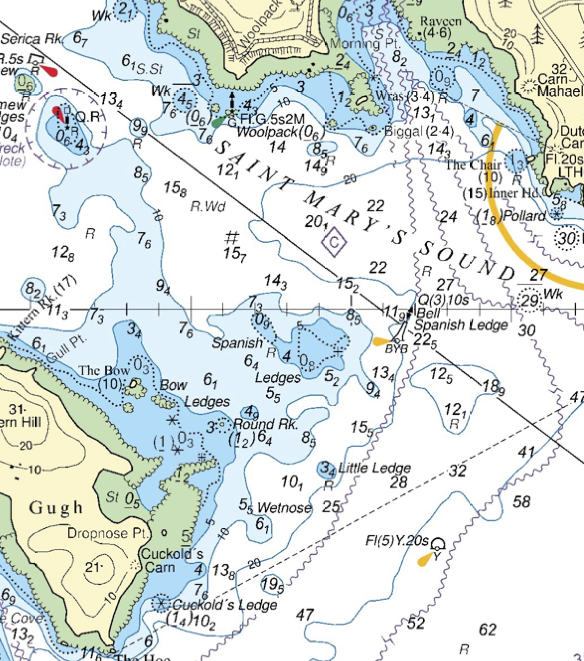
Describe the tidal flow in Saint Mary’s Sound on July 4th 2017? We notice that the tidal stream tables refer to high water at Plymouth. We must begin by consulting a Plymouth tide table:
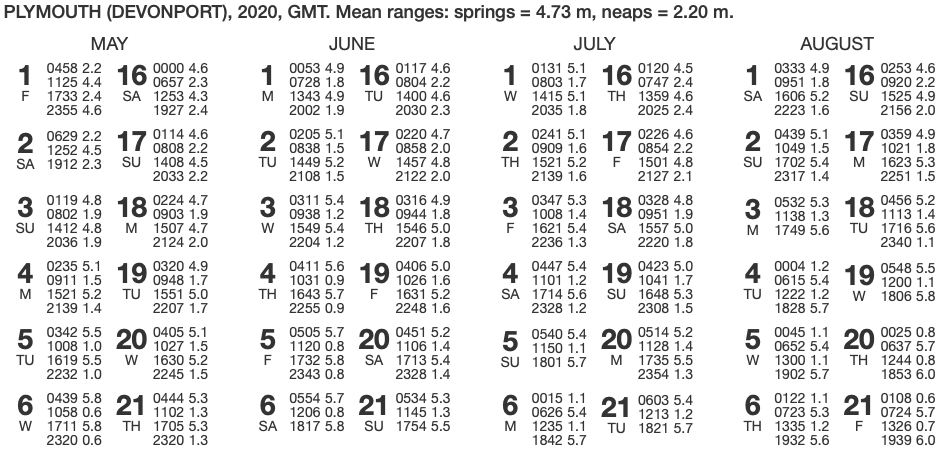
On July 4th, we have the following times of high and low water, remembering to add the hour for British Summer time:
05:47 5.4 m High Water
12:01 1.2 m Low Water
18:14 5.6 m High Water
We note that the tidal range is 4.4 m, and the factor is 4.4/4.73 = 93%, which is close to springs. We will use the left hand column for diamond C which gives the rates at spring tides.
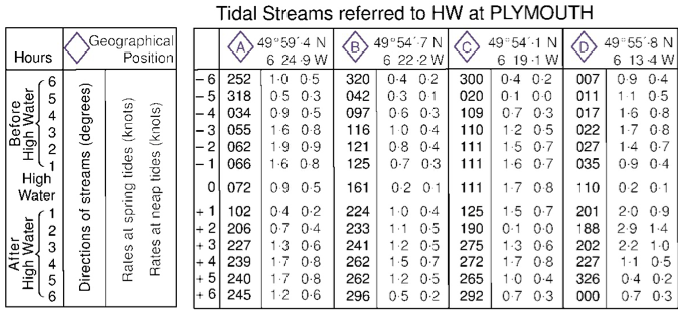
The table below shows data taken from tidal diamond C related to times on June 14. It has been created by entering the HW times for Plymouth on the ‘0’ row then counting backward and forward up and down the table:
| Time relative to HW | Bearing | Time of day | Rate | Comment |
|---|---|---|---|---|
| -6 | 300 | 12:14 | 0.4 kt | |
| -5 | 20 | 13:14 | 0.1 kt | Tide is turning to the east |
| -4 | 109 | 14:14 | 0.7 kt | |
| -3 | 110 | 15:14 | 1.2 kt | |
| -2 | 111 | 16:14 | 1.5 kt | |
| -1 | 111 | 17:14 | 1.6 kt | |
| 0 | 111 | 05:47 , 18:14 | 1.7 kt | Tide runs at maximum speed east |
| +1 | 125 | 06:47 | 1.5 kt | |
| +2 | 190 | 07:47 | 0.1 kt | Tide is turning to the west |
| +3 | 275 | 08:47 | 1.3 kt | |
| +4 | 272 | 09:47 | 1.7 kt | Tide runs west at maximum rate |
| +5 | 265 | 10:47 | 1.0 kt | |
| +6 | 292 | 11:47 | 0.7 kt |
So, the tide starts flowing west a little after 07:47 in the morning. At around 09:47, it reaches a maximum speed in the westward direction of 1.7 knots. The speed drops until around 13:14, when the tide swings to the north, before starting to run east. It reaches the maximum speed eastward of 1.7 knots at around 18:14 in the evening.
Note the approximate times given – we only have data at each hour, so we can only estimate the times of slack water and maximum flow.
2.3.2 Tidal stream atlases
The UKHO publishes a series of tidal stream atlases that cover the UK. Atlases for smaller areas are sometimes found on nautical charts. Atlases can be found from other sources (e.g. in Reeds Almanac), but these are normally from UKHO data. Exceptions include a couple of standalone books published by local yachtsman covering specific areas of popular coastline and going into great local detail. Excellent flow atlases are also found in some pilot books.
Visit My Harbour is a great source, providing all the main UKHO tidal stream atlases for free.
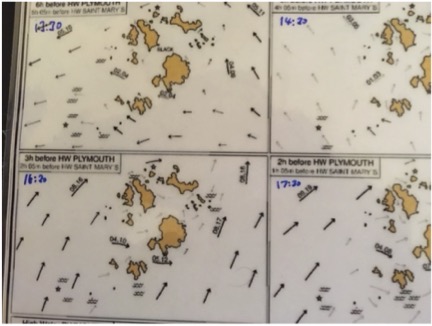
A tidal stream atlas is a series of maps that show tidal flows at different times in a tidal cycle:
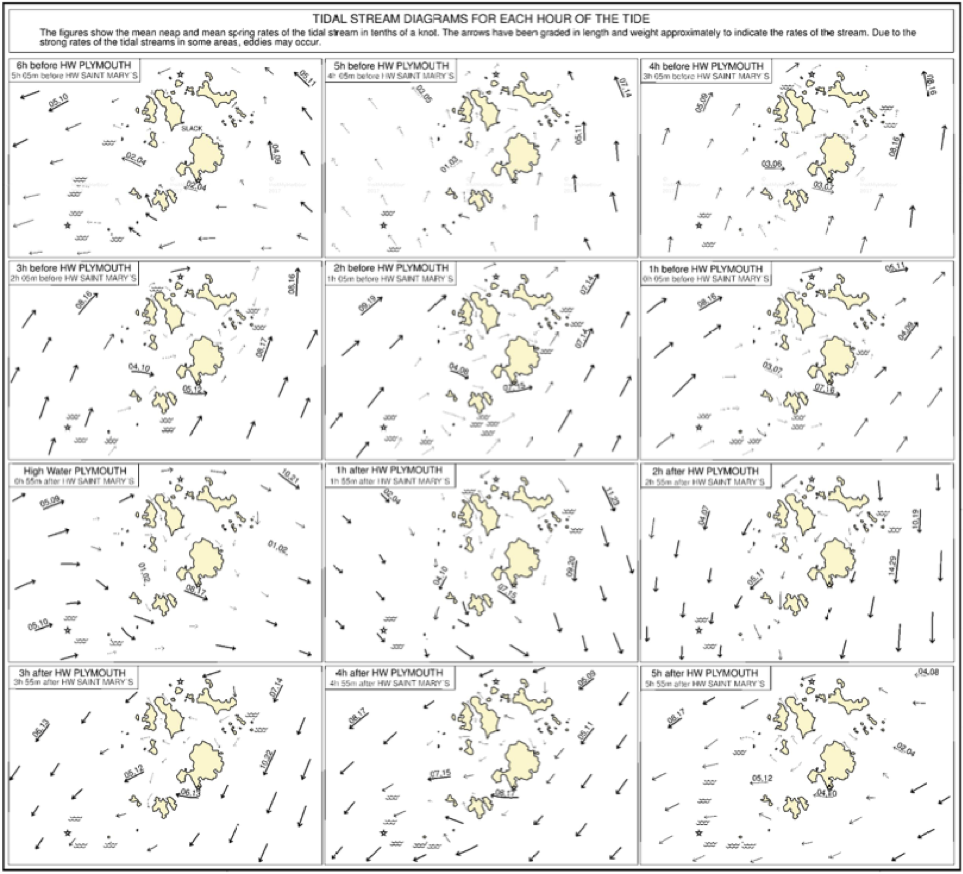
The thickness of arrows on an atlas gives an approximate indication of tidal speed. When numbers are shown, they are in tenths of a knot, with a comma separating flow speeds for springs and neaps.
Tidal stream atlases can be of limited use for inshore kayaking, although there are many areas where they are very useful – especially around island archipelagos like the Scillies, Orkney and the Channel Islands.
A good way to use an atlas is to mark it up with the timings for the day to get a feel for what the tide is going to do across the area, as shown below:
2.3.3 Pilots and guidebooks
Tidal diamonds and detailed tidal atlases are not available for all areas. Often, we must rely on less complete data given in narrative form from local experts. Such data can be found in sailing directions, books that are written to convey local knowledge to mariners. These are colloquially know as ‘pilots’. The UKHO publishes a range of pilots covering the UK in detail and the rest of the world in less detail. Other national agencies do the same. The information in these pilots is primarily intended for large ships, so yachtsman have produced their own pilots, often with more detailed information, for areas in which they cruise. These are often useful for kayakers.
Sea kayaking guidebooks include the most important tidal information from pilots and other sources. Being focused on kayaks, rather than large ships or yachts, they’re a great source of information in a compact format. Over the last few year, Pesda Press has published an excellent set of guidebooks covering most of the UK. For most kayakers, these books will be cheaper, more accessible and better than UKHO or yachting pilots.
All pilots use a similar format for describing tidal streams. In sea kayak pilots you will also see tidal stream data shown graphically on maps:
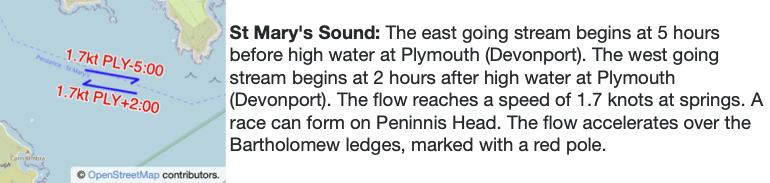
Pilot information is presented in a fairly understandable format. Its use is best illustrated by an example.
Describe the tidal flow in Saint Mary’s Sound on June 14th 2017 (HW Plymouth is at 09:29 BST and 21:44 BST)?
We already know that HW Plymouth is at 09:29 BST and 21:44 BST.
The ESE stream begins HW Plymouth -5:00
09:29 – 05:00 = 04:29 BST
21:44 – 05:00 = 16:44 BST


The WNW stream begins HW Plymouth +2:00
09:29 + 02:00 = 11:29 BST
21:44 + 02:00 = 23:44 BST
So, we expect the tide to run ESE in the morning (from 04:29), turning WNW at 11:29. It turns ESE again at 16:44, running in this direction until 23:44.