2.10 Predicting speeds of tidal streams
We have focused so far on determining which way the tidal stream will be flowing and when. This is often enough to plan a simple sea kayak journey. However, it is sometimes useful to estimate the speed of the tide with greater precision.
Information from either tidal diamonds or a tidal stream atlas can give information on flow speeds at springs and neaps for each hour. What if it isn’t springs or neaps?
There are two methods to calculate tidal flows – using factors and using interpolation. Factors are quicker, but interpolation may be a little more accurate.
We calculated a tidal factor earlier as the ratio between the actual tidal range and the range at mean springs. Given that the tidal range is what drives the tidal streams, we can simply multiply the factor by the flow speed at springs to estimate the speed that we will experience.
What will the maximum flow be in St. Mary’s Sound on 1 June 2020?
We previously consulted a tidal diamond (and a pilot) and found that maximum flow speed in the Sound is 1.7 knots at springs (and 0.8 knots at neaps).
Consulting the Plymouth tide table….
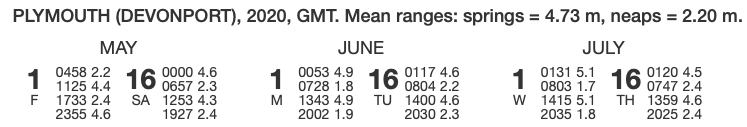
The tidal range on June 1st is 4.9-1.8 = 3.1 meters. Given that the mean range at springs is 4.73m, the factor is 3.1/4.73 = 0.65 - i.e. between springs and neaps.
We estimate the maximum flow as 0.65 X 1.7 = 1.1 knots.
Interpolation The method of interpolation uses both the springs and neaps flow speeds and associated tidal ranges to calculate flow speed at an intermediate tidal range. This can be done using an equation or graphically. The equation is:
\[ speed@neaps+\left(speed@springs-speed@neaps\right)\frac{range-range@neaps}{range@springs-range@neaps} \]
Using this is clearly a pain, so the calculation is more commonly done graphically using a plot found on the inside cover of a tidal stream atlas:
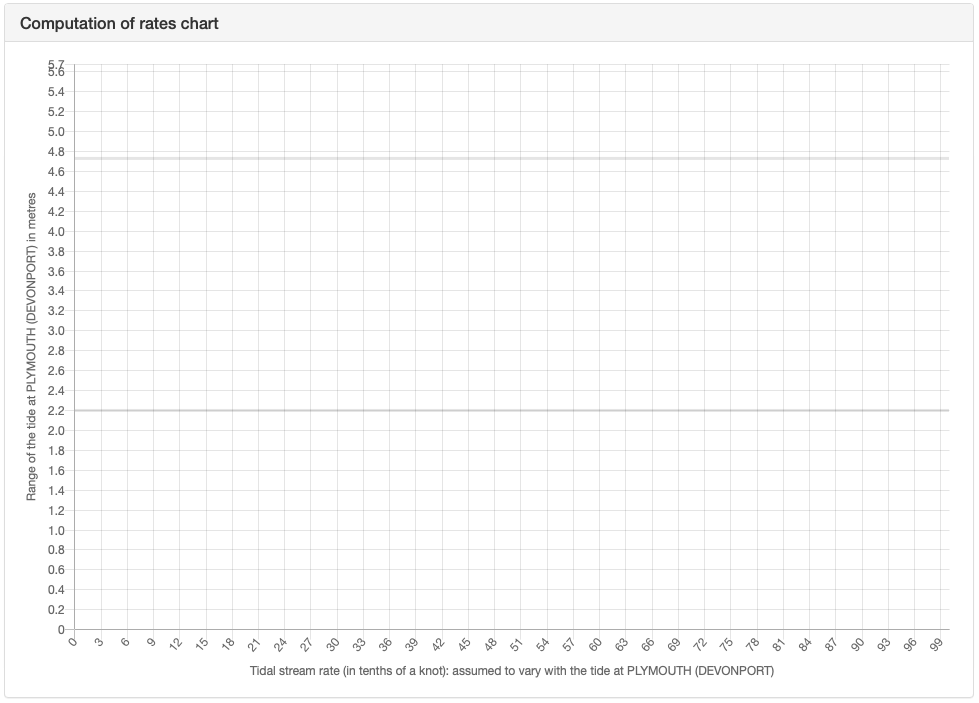
Tidal stream flows for both springs and neaps are plotted on this diagram against the corresponding tidal ranges – mean springs and neaps ranges being shown on the diagram. A straight line is drawn between these two points. This line can be used to calculate a speed for any given tidal range. An example will help explain:
Estimate the fastest speed of tidal flow in Saint Mary’s Sound on 1 June 2020?
We previously consulted a tidal diamond and found that maximum flow occurs at HW Plymouth and 4 hours later and is 1.7 knots at springs, 0.8 knots at neaps.
We also know from the tide tables that:
range at mean springs = 4.73 m
range at mean neaps = 2.20 m
Note that these correspond to the position of the dotted lines on the computation of rates chart, as we would expect. The tidal range on June 1st is 3.1 m.
USING THE EQUATION:
Speed = speed@neaps + (speed@springs - speed@neaps)X(range - range@neaps)/(range@springs - range@neaps)
Speed = 0.8 knots + (1.7 knots – 0.8 knots)X(3.1 m – 2.20 m)/(4.73 m – 2.20 m)
Speed = 0.8 knots + 0.9 knotsX 0.9 m/2.53 m
Speed = 0.8 knots + 0.32 knots = 1.1 knots
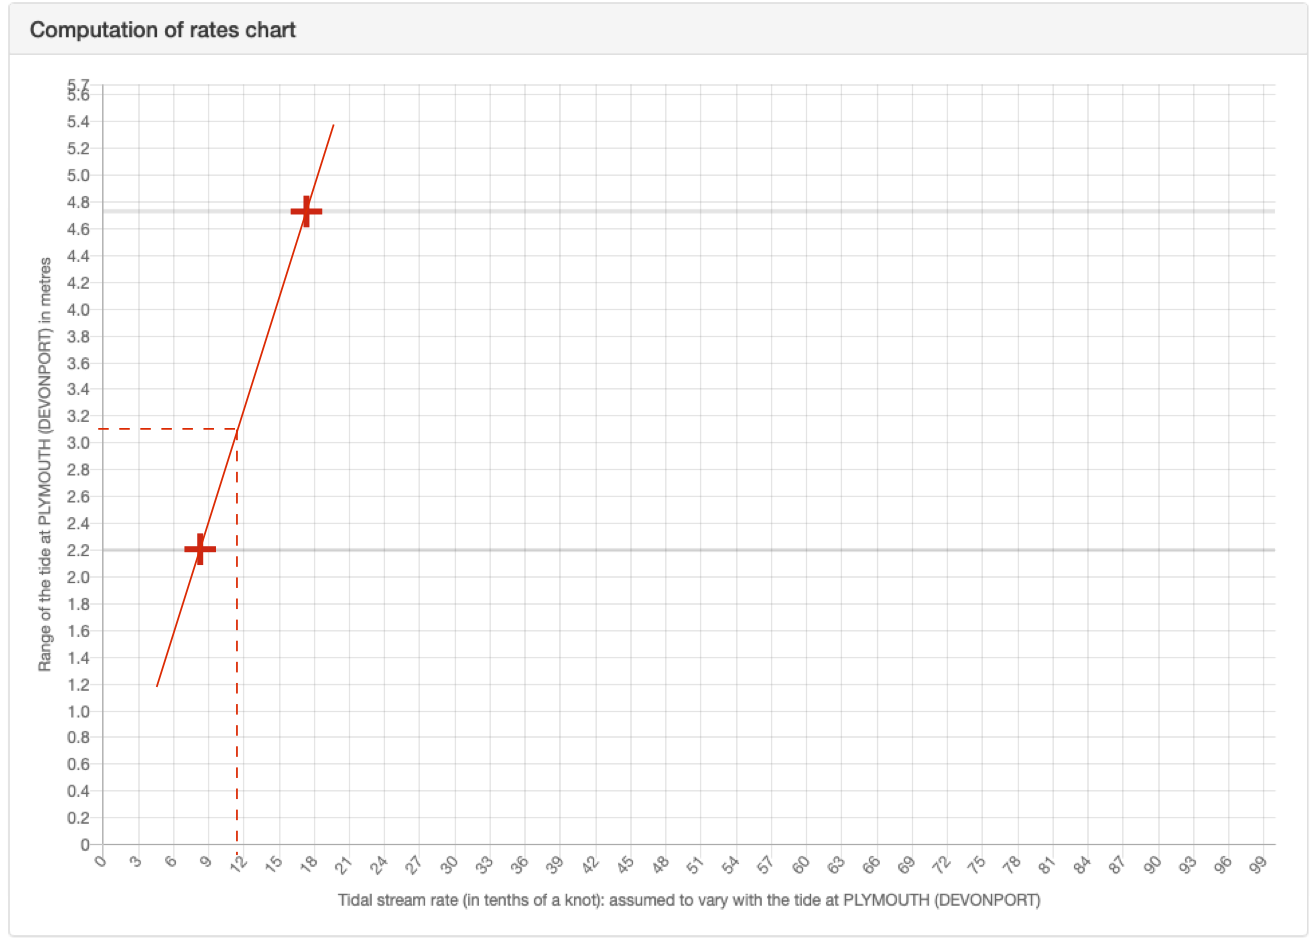
USING THE DIAGRAM:
Mark the speed at springs (1.7 knots) on the upper grey horizontal line, (upper red cross). Similarly, mark the speed at neaps (0.8 knots) on the lower horizontal line (lower red cross).
Draw a straight line (non-dashed red line) between these two crosses.
Draw a horizontal line across from the tidal range on June 1st (3.1 m) (horizontal dashed red line). Where this meets the line drawn previously, draw a final line down vertically. This goes to around ‘11’, indicating 1.1 knots.