Chapter 4 Introduction to Tidyverse
The tidyverse package actually contains other packages (dplyr, ggplot2, etc.) and you’ll see that when you load the tidyverse package using library(). Remember the package must be installed to your device before it can be loaded into your libraries! For help on installing packages, refer to Section 3.2.3.
library(tidyverse)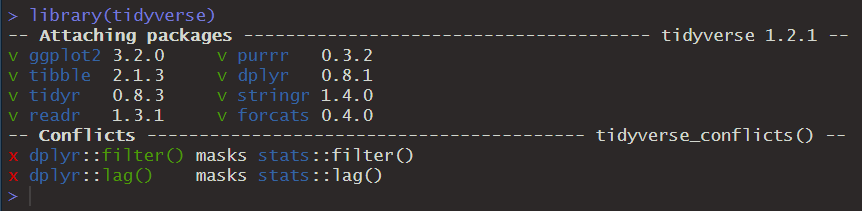
Figure 4.1: Tidyverse loading messages in the console.
You’ll also notice that there are some functions that are masked after loading tidyverse (Fig. 4.1). To understand what this means, let’s take a look at our “Packages” tab in the bottom right window of RStudio.
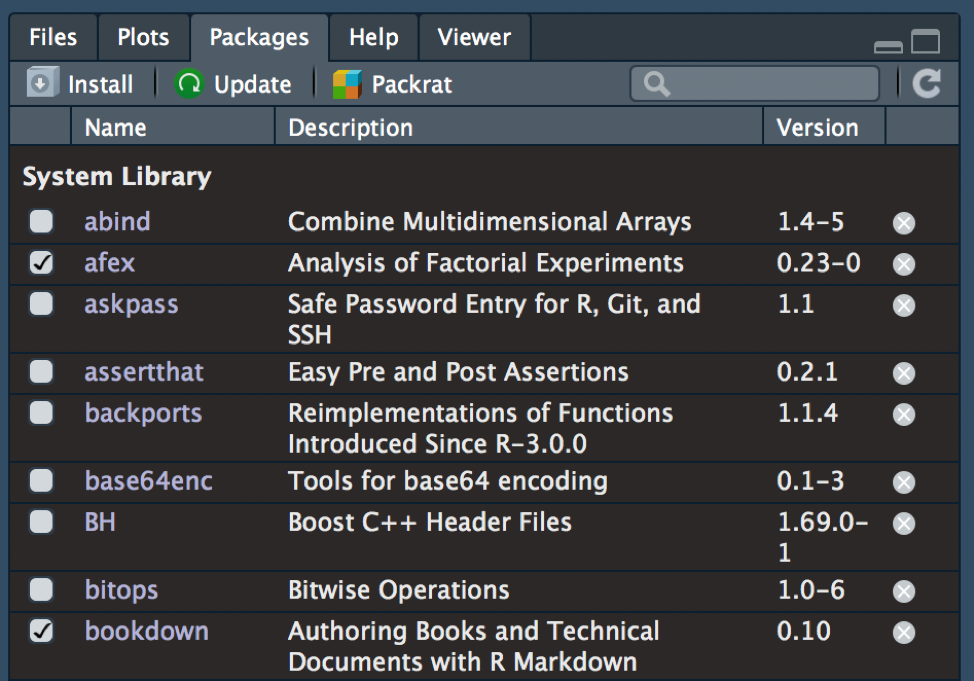
Figure 4.2: Partial list of currently installed packages.
My packages list will be slightly different from yours. The point is: there are many different packages installed on your computer.
Recall that packages consist of a collection of functions related to a particular purpose (e.g., ggplot2 contains functions for graphing). We know that packages must be loaded to your libraries each time a new RStudio session begins and installed once per R version update (Section 3.2.3). When a package is loaded (with library()), R will import the entire package (all functions, documentation, built-in datasets) to your current workspace.
Why doesn’t R just keep all packages always loaded to begin with? Why do we have to load the package libraries for every RStudio session? The reason is simple: packages often have naming conflicts with other packages. While package authors attempt to uniquely name their functions, concise and descriptive names are limited and naming conflicts with functions from other packages are inevitable. For example, if you execute ?filter() after loading the tidyverse package, two help pages pop up: one from the dplyr package and one from the stats package. These functions work differently and it is important to know which function you are using in your code.
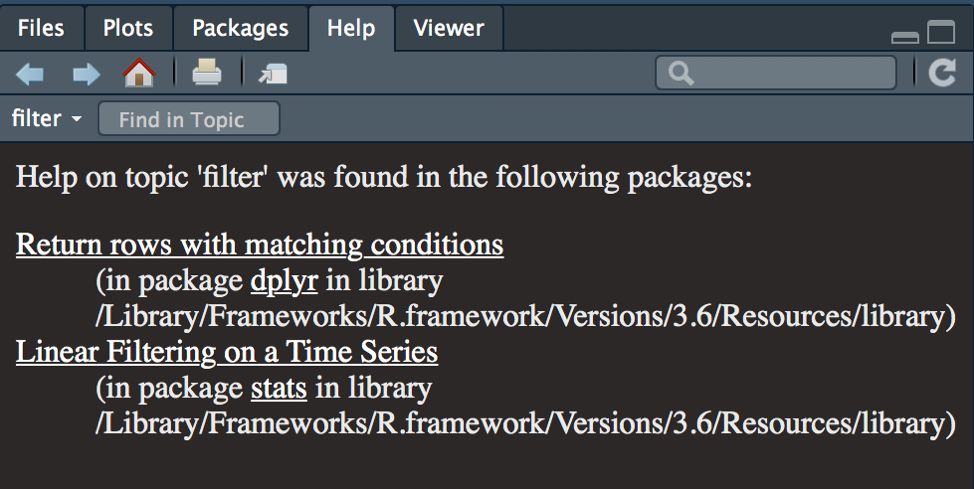
Figure 4.3: Different packages with same function names.
How does R pick which package’s definition to use for filter()? It decides based on which package was loaded most recently. The stats package is a base R package pre-loaded at the beginning of your R session. When you load the tidyverse package, which also loads the dplyr package, the definition of filter() switches over to the dplyr version.
To prevent accidental usage of the undesired function, some R users prefer to load individual functions as opposed to loading an entire library. If all you need to use from the dplyr package is the filter() function, you could execute the following:
## loads ONLY the filter function from dplyr
dplyr::filter()

## loads ALL functions from dplyr, then using filter()
library(dplyr)
filter()

# Functions in this example are empty for illustration purposes.
# Usually, use of functions will require arguments inside.
Loading an individual function from a package will not change how the function itself works; all of the required arguments will be the same (for a refresher on functions, see 3.3.8). This method of loading individual functions can be tedious if you plan on using the function multiple times or if you need other functions from the same package. Thus, loading single functions is generally used sparingly.
Finally, let’s briefly talk about the organization/structure of this chapter. Many examples in this chapter will display the code written/executed followed by the output printed in the console. If you follow along and execute the code, the output shown in the book should match the output in your console. The code and output are located in separate blocks and can be differentiated by the color coordination (R code will contain selective color coding) and comments (an output will contain only comments using ##; the output on your computer will not display the ## symbols).
Example
## This is an example code
diamonds %>%
  group_by(clarity) %>%
  summarize(m = mean(price)) %>%
  ungroup()
## # A tibble: 8 x 2
## clarity m
## <ord> <dbl>
## 1 I1 3924.
## 2 SI2 5063.
## 3 SI1 3996.
## 4 VS2 3925.
## 5 VS1 3839.
## 6 VVS2 3284.
## 7 VVS1 2523.
## 8 IF 2865.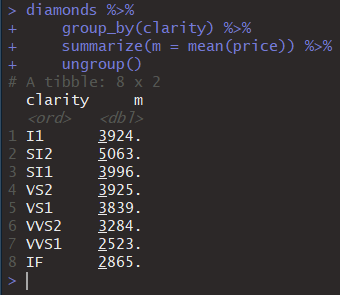
Figure 4.4: Image of actual output in the RStudio console.
Experiencing errors? Refer back to the Troubleshooting section (3.6)!
Tidyverse has lots of useful functions, but this chapter will introduce the basic ones. Follow along by executing the example code in the upcoming sections.