3.4 R Conventions
3.4.1 Header and Comment Organization
It’s a good idea to organize your code and code descriptions so that “Future You” or your collaborators can easily navigate your script. Here are some of my tips:
RStudio has the ability to organize code sections within a single script (e.g., loading libraries, data management, graphing, statistics, exporting to Excel). You can jump to the different sections by clicking on the drop-down menu at the bottom of the script window. If you have not created a header yet, the button will read “(Top Level)” – see fig 3.26.
You can create RStudio headers using the
Ctrl + Shift + Rcommand. A text box will automatically pop up for you to name. This ensures that the length of all headers are equal and it saves you time from typing out the dashes.By default, four dashes will create an RStudio header (—-)
You may choose to use other heading styles (that won’t be tracked by RStudio). One method I enjoy using for visualization is:
#__________________which uses underscores. This allows for clear visualization of section headers, but will not be tracked by RStudio unless followed with four consecutive dashes. Make sure your header style is consistent!
## Here are a couple of options for header styles
## Stick with ONE style!

#___________________________________
#  Loading Libraries
#___________________________________
library(tidyverse)
library(writexl)

#***********************************
# Importing Dataset
#***********************************
data <- read_csv("mydataset.csv")

# Alter Data Structure ----
data <- data %>% mutate(variable = factor(variable))

# Graphing -------------------------
data %>% ggplot(aes(x = var1, y = var2)) +
  geom_point()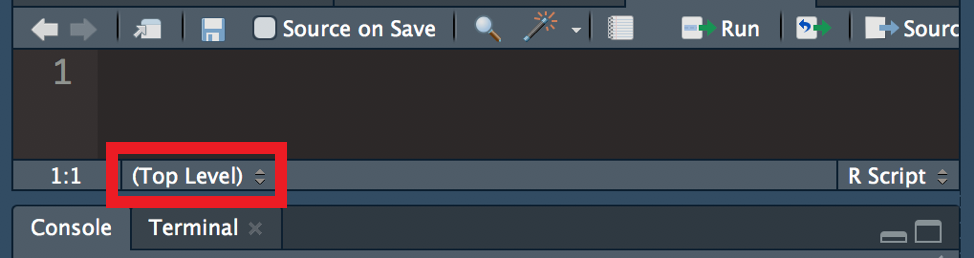
Figure 3.26: Accessing labeled sections in your script
Similarly, everyone has their preference for how they organize comments that serve as code descriptions. Here are some examples:
# This is a section label ----

# I have section labels for things like:
  # Importing packages
  # Setting up data
  # Setting up graphs

# Think about...
  # Spacing between code and comments
  # How you might want to indent code/comments
    # I prefer to indent my code/comments in a
    # manner that allows me to easily read all
    # lines without having to horizontally scroll.

### You could also distinguish text
## with multiple #
# such as this

# You can provide descriptions for code above:
# Calculates mean of numbers 1-5
mean(1:5)
## [1] 3# Or you can type the comments beside the code
mean(1:5) # Calculates mean of numberes 1-5## [1] 33.4.2 Naming
It’s a good idea to stick to a consistent format for organizing your code (section headers) and naming files/folders/scripts/objects—be consistent. It helps Future You keep track of what’s going on. Here are some of my naming pointers:
1. Choose Descriptive and Concise Names
It can be painful to type out long object names each time you refer to it—even with the autofill feature.
2. Do Not Start with a Number or Symbol
R will not recognize an object name that begins with a number. However, you can still include numbers in the middle or at the end your object name:
Data5is a good nameData5bis a good name5Datais a bad name
3. Avoid use punctuation other than a period (.), dash (-), or underscore (_)
Some punctuation are understood as special commands.
= equal signs are used to define things
- plus signs signal mathematical addition (same with other operators)
! exclamation signs are used to indicate “not equal”
‘ apostrophes and quotations are used to indicate that an object is a string/character Similarly, do not begin your label with a symbol!
Data_5is a good name_Datais a bad name
4. No Spaces
R considers spaces as separate text. Instead, consider labeling your objects like so:
ThisVariablethis.variablethis_variablethis-variable
5. Consistency
Stick with a consistent naming convention you prefer, some include:
Labeling all objects in lowercase only (
nameofmyobject)Labeling all objects in uppercase only (
NAMEOFMYOBJECT)Separating words with periods only (
name.of.my.object)Separating words with underscores only (
name_of_my_object)Selectively using uppercase (
NameOfMyObject)
6. Avoid Names Already in Use
How do you know if it is already a name of an object (value, function, graph)? RStudio is really user-friendly and will suggest autocompleting options from its built-in objects as well as from your global environment as you type.
For example, diamonds is already a name for a built-in dataset. If you label your new object “diamonds”, it will override the original definition. Instead of naming over the original dataset, I could use a slightly modified name for my new object:
diamonds_new <- diamondsIf you use the same name for two different objects, only the object that was defined most recently will remain:
my.object <- 1 + 2
my.object <- 4 + 5
If I run the first line, then run the second line, my.object will be defined as 4 + 5. Afterwards, if I run the first line again, the value of my.object will change back again to 1 + 2. The most recently executed definition will be the most current definition.
It is better to not use the same label for objects unless you want to overwrite the original value. Instead, use something like m1, m2, m3 to define different renditions of the original object. It is prudent to overwrite an object only when you are 100% certain that the old definition is no longer useful.
R cares about lowercase and uppercase: Library() is not the same as library(). In fact, Library() is not a recognized function by default, there will be an error. Spelling or capitalization mistakes are one of the most common sources of error!
3.4.2.1 Exceptions to the Rules
As always, there are some exceptions to naming rules. It is not recommended to use a name beginning with a number or containing an illegal character (e.g., spaces, slashes, or symbols other than the underscore, dash, or period).
If you must know, there is a way to get around this by surrounding the ill-conceived object name with backticks (``). Backticks are located on the same key as the tilde (~):
## Bad Names

# Begins with a number
`10bad.name`

# Begins with a number, has two illegal characters (percent and space)
`100% Terrible`

# Contains illegal character (forward slash)
`Response/second`
It’s not advised to use poor names because they can increase the likelihood of user error and because not all functions will accept this workaround.
3.4.3 Built-In Symbols
R has all of the basic arithmetic operations available (+, -, /, *, ^) and can function as a calculator. However, R is also a powerful tool for managing our data.
This table introduces some of the other basic operators that we will frequently use on our datasets. We will practice using these built-in symbols in chapter 4 .
| Symbol | Definition | Example |
|---|---|---|
| = | A single equal means as defined as, NOT equals. This can be used to define variable names within a dataset (most common use) or objects/datasets (not recommended use). | variable = 2 translates to: the object labeled variable is defined as the number two |
| <- | Defines objects/datasets. The single equal sign (=) should only be used to define an object within a larger dataset. The arrow (<-) is used to define objects that are not part of larger datasets. | dataset <- 2 translates to: the object labeled dataset is defined as the number two |
| == | Equal(s) | variable == 2 translates to: retrieve values from the object labeled variable that equal two |
| != | Does not equal | variable != 2 translates to: retrieve values from the object labeled variable that do not equal two |
| > | Greater than | variable > 2 translates to: retrieve values that are greater than two from the object labeled variable |
| >= | Greater than or equal to | variable >= 2 translates to: retrieve values that are greater than or equal to two from the object labeled variable |
| < | Less than |
variable < 2 translates to: retrieve values that are less than two from the object labeled variable
|
| <= | Less than or equal to | variable <= 2 translates to: retrieve values that are less than or equal to two from the object labeled variable |
| %in% |
Determines whether values match (TRUE/FALSE). The format for use is x %in% table where x and table are vectors.
|
2 %in% c(2,3,4) translates to: Does the value on the left match anything in the vector on the right? This would return TRUE the left value has a match on the right value(s).c(2,3,4) %in% 2 would return TRUE FALSE FALSE as each value on the right would return TRUE/FALSE for whether it matches with the value on the right of %in%.
|
| | |
Translates to the word “or”. | can be used to retrieve matching values that meet at least one condition.
|
variableA > 5 | variableB == TRUE translates to: retrieve values where variableA is greater than five or where the values of variableB are TRUE. |
| & |
Translates to the word “and”. & can be used to retrieve matching values that meet all conditions listed.
|
variableA > 5 & variableC == “male” translates to: retrieve values where variableA is greater than five and where the values of variableC equal “male” |
3.4.4 Built-In Datasets
R has some datasets built-in. Like built-in symbols, some names refer to a built-in dataset that has already been defined. These datasets are usually used as examples for instructors to teach data management without having to provide a unique dataset. They are also sometimes used to ask questions so that anybody using R can follow along (if you have a specific kind of problem, it’s going to be difficult for people who don’t have access to your dataset to help you). If I refer to a dataset without specification, it’s most likely a built-in dataset that you will already have access to. To see the built-in datasets, execute the following code:
data()Some of the most common datasets I like to use for examples include mtcars, diamonds, & midwest. These built-in datasets sometimes require certain packages to be loaded into your library. mtcars is available by default; however, in order to use the diamonds and midwest datsets, the ggplot2 package is required. If you load the tidyverse package, the ggplot2 package will automatically load as well.