Chapter 9 Scatter Plots
Scatter plots are among the easiest graphs to create, because each point represents a single observation. Let’s build a scatterplot with the diamond’s depth on the x-axis and the price on the y-axis.
diamonds %>%
  ggplot(aes(x = depth, y = price)) +
  geom_point()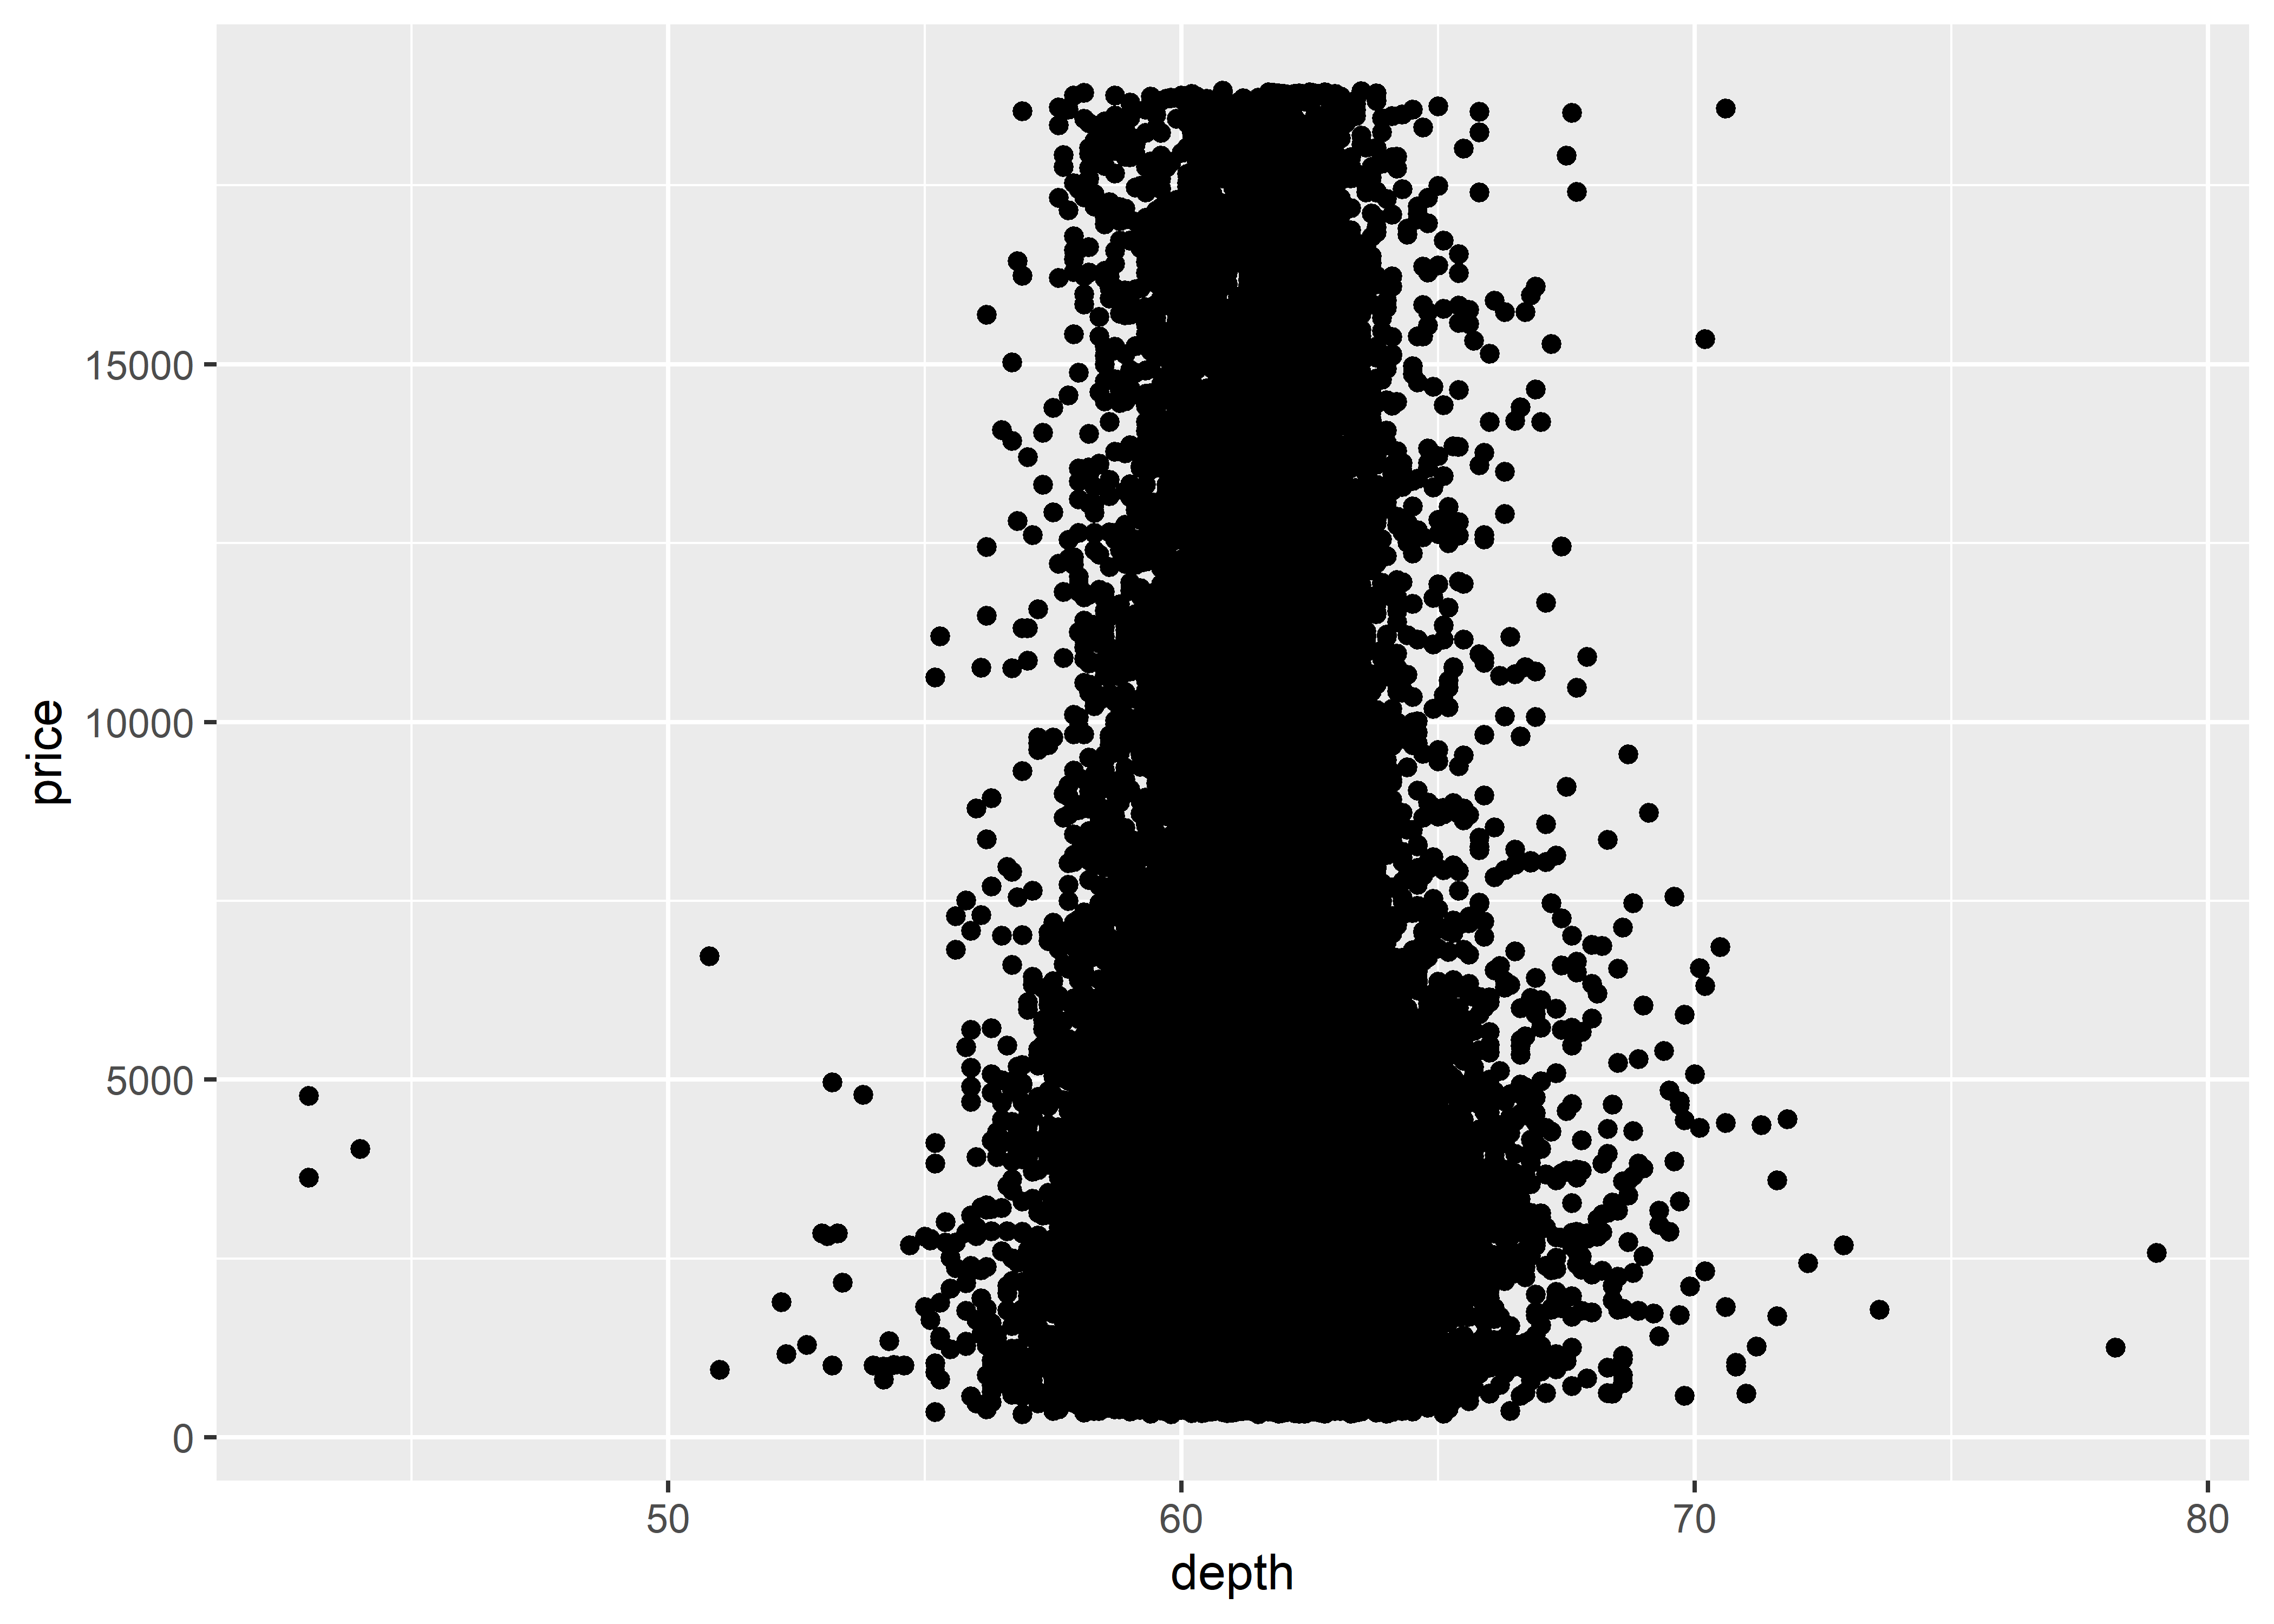
Figure 9.1: Basic scatterplot measuring price and depth variables in the diamonds dataset
Using the ?ggplot help page, we see that the first argument for ggplot() is the dataset. Here, we are using the built-in diamonds dataset. Next, we must add aesthetics using the aes() function. There are a lot of aesthetic options, but for now, we will focus on the basics. By default, the aes() function requires at minimum an x and a y argument. Again, you may choose to omit the argument names (x and y), but then R will then assume that the first listed variable in aes() is the x-axis variable and the second variable is the y-axis variable.