11.5 Graphing with Different Datasets
One final note is that geom elements (geom_point(), geom_line(), etc.) can plot data from two (or more) different datasets. Let’s see an example:
## creating dataset #1
data1 <-
  diamonds %>%
  group_by(clarity) %>%
  summarize(m = mean(price))

## creating dataset #2
data2 <-
  diamonds %>%
  group_by(clarity, cut) %>%
  summarize(m = mean(price))

## graphing data points from 2 different datasets on one graph
ggplot() +
  geom_point(data = data1, aes(x = clarity, y = m), color = "blue") + # must include argument label "data"
  geom_point(data = data2, aes(x = clarity, y = m))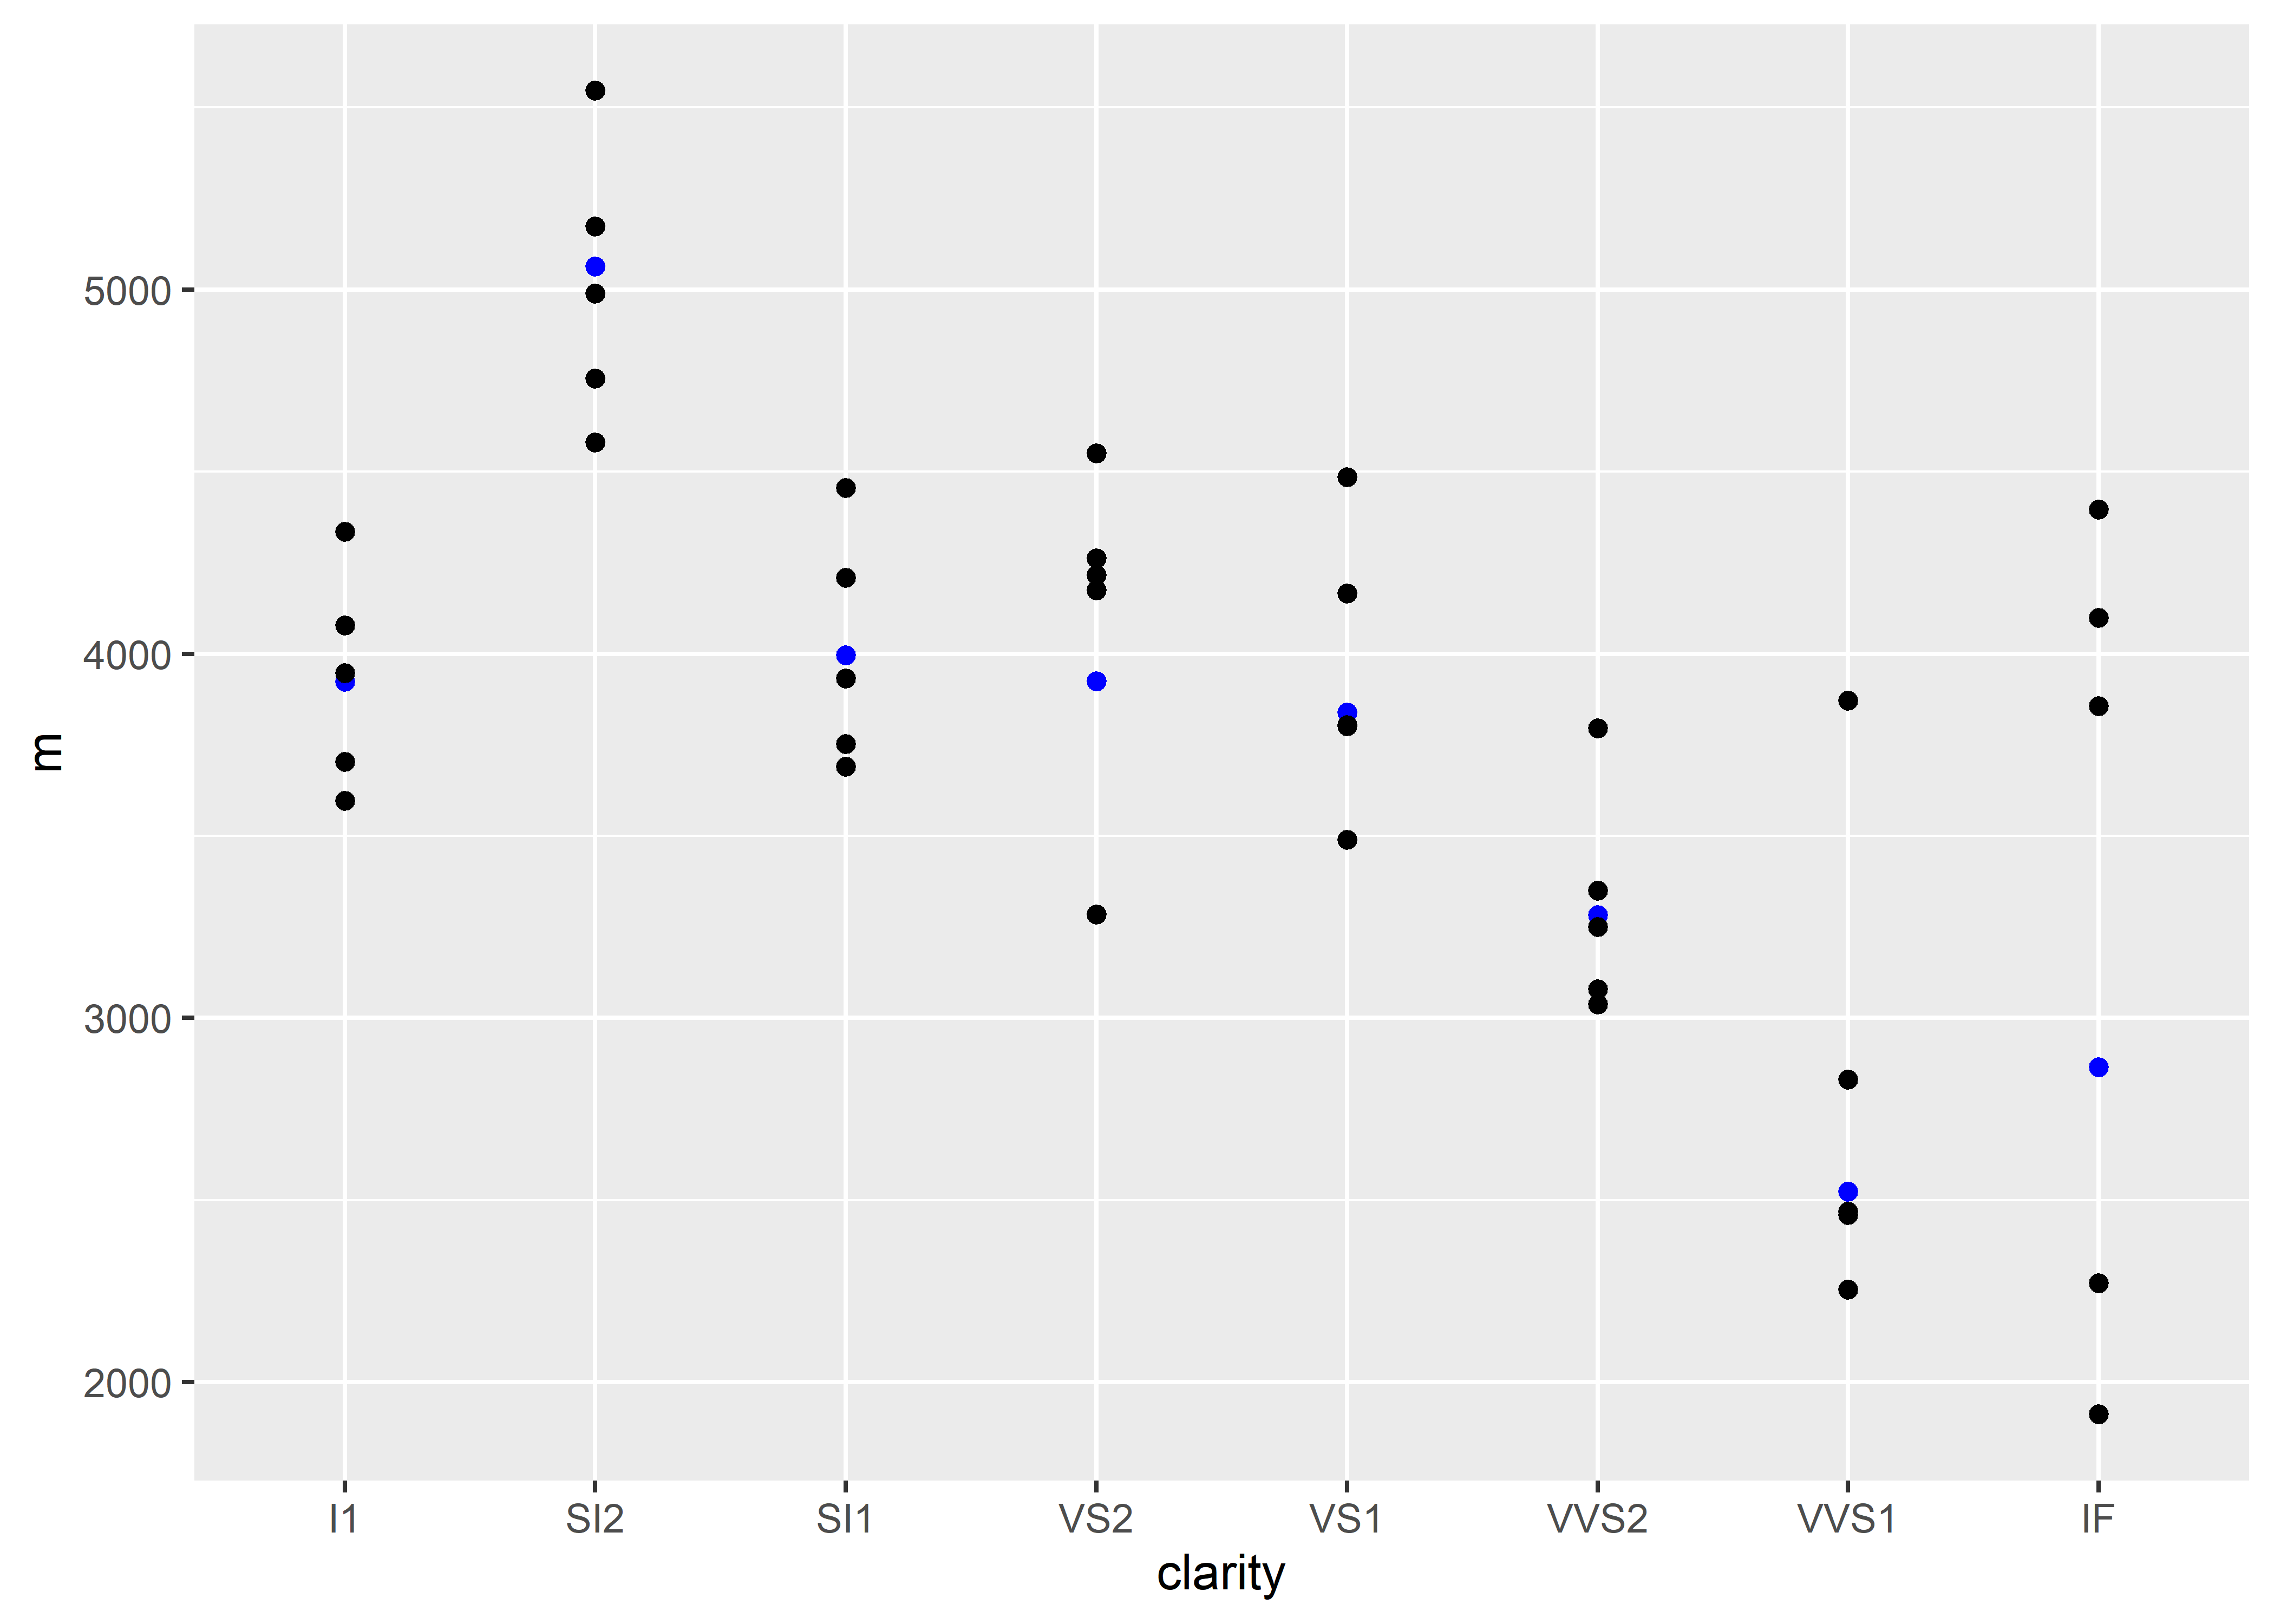
In the above example, the data from the dataset called data1 is colored in blue for distinction. This data’s values calculate the mean (average) price of diamonds for each clarity (simply execute data1 or View(data1) to view the data). The data from the dataset called data2 is colored in black. This dataset’s values are derived from the mean (average) price of diamonds for each clarity and cut category. Again, the x and y values must be the same (clarity and m).
Within each geom element, you specify the name of the dataset with the argument label data =. This is because the first argument for many of the geom functions is the aesthetic mapping by default. Note that you can plot with multiple datasets for any other geom element too. You could have a geom_bar() for data1 and a geom_point() for data2 if you wanted to! If for some reason you wanted to plot error bars from data1 and data points from data2, you could do that also. This would likely be a terrible graph, but you could.