10.8 Labeling Your Graph
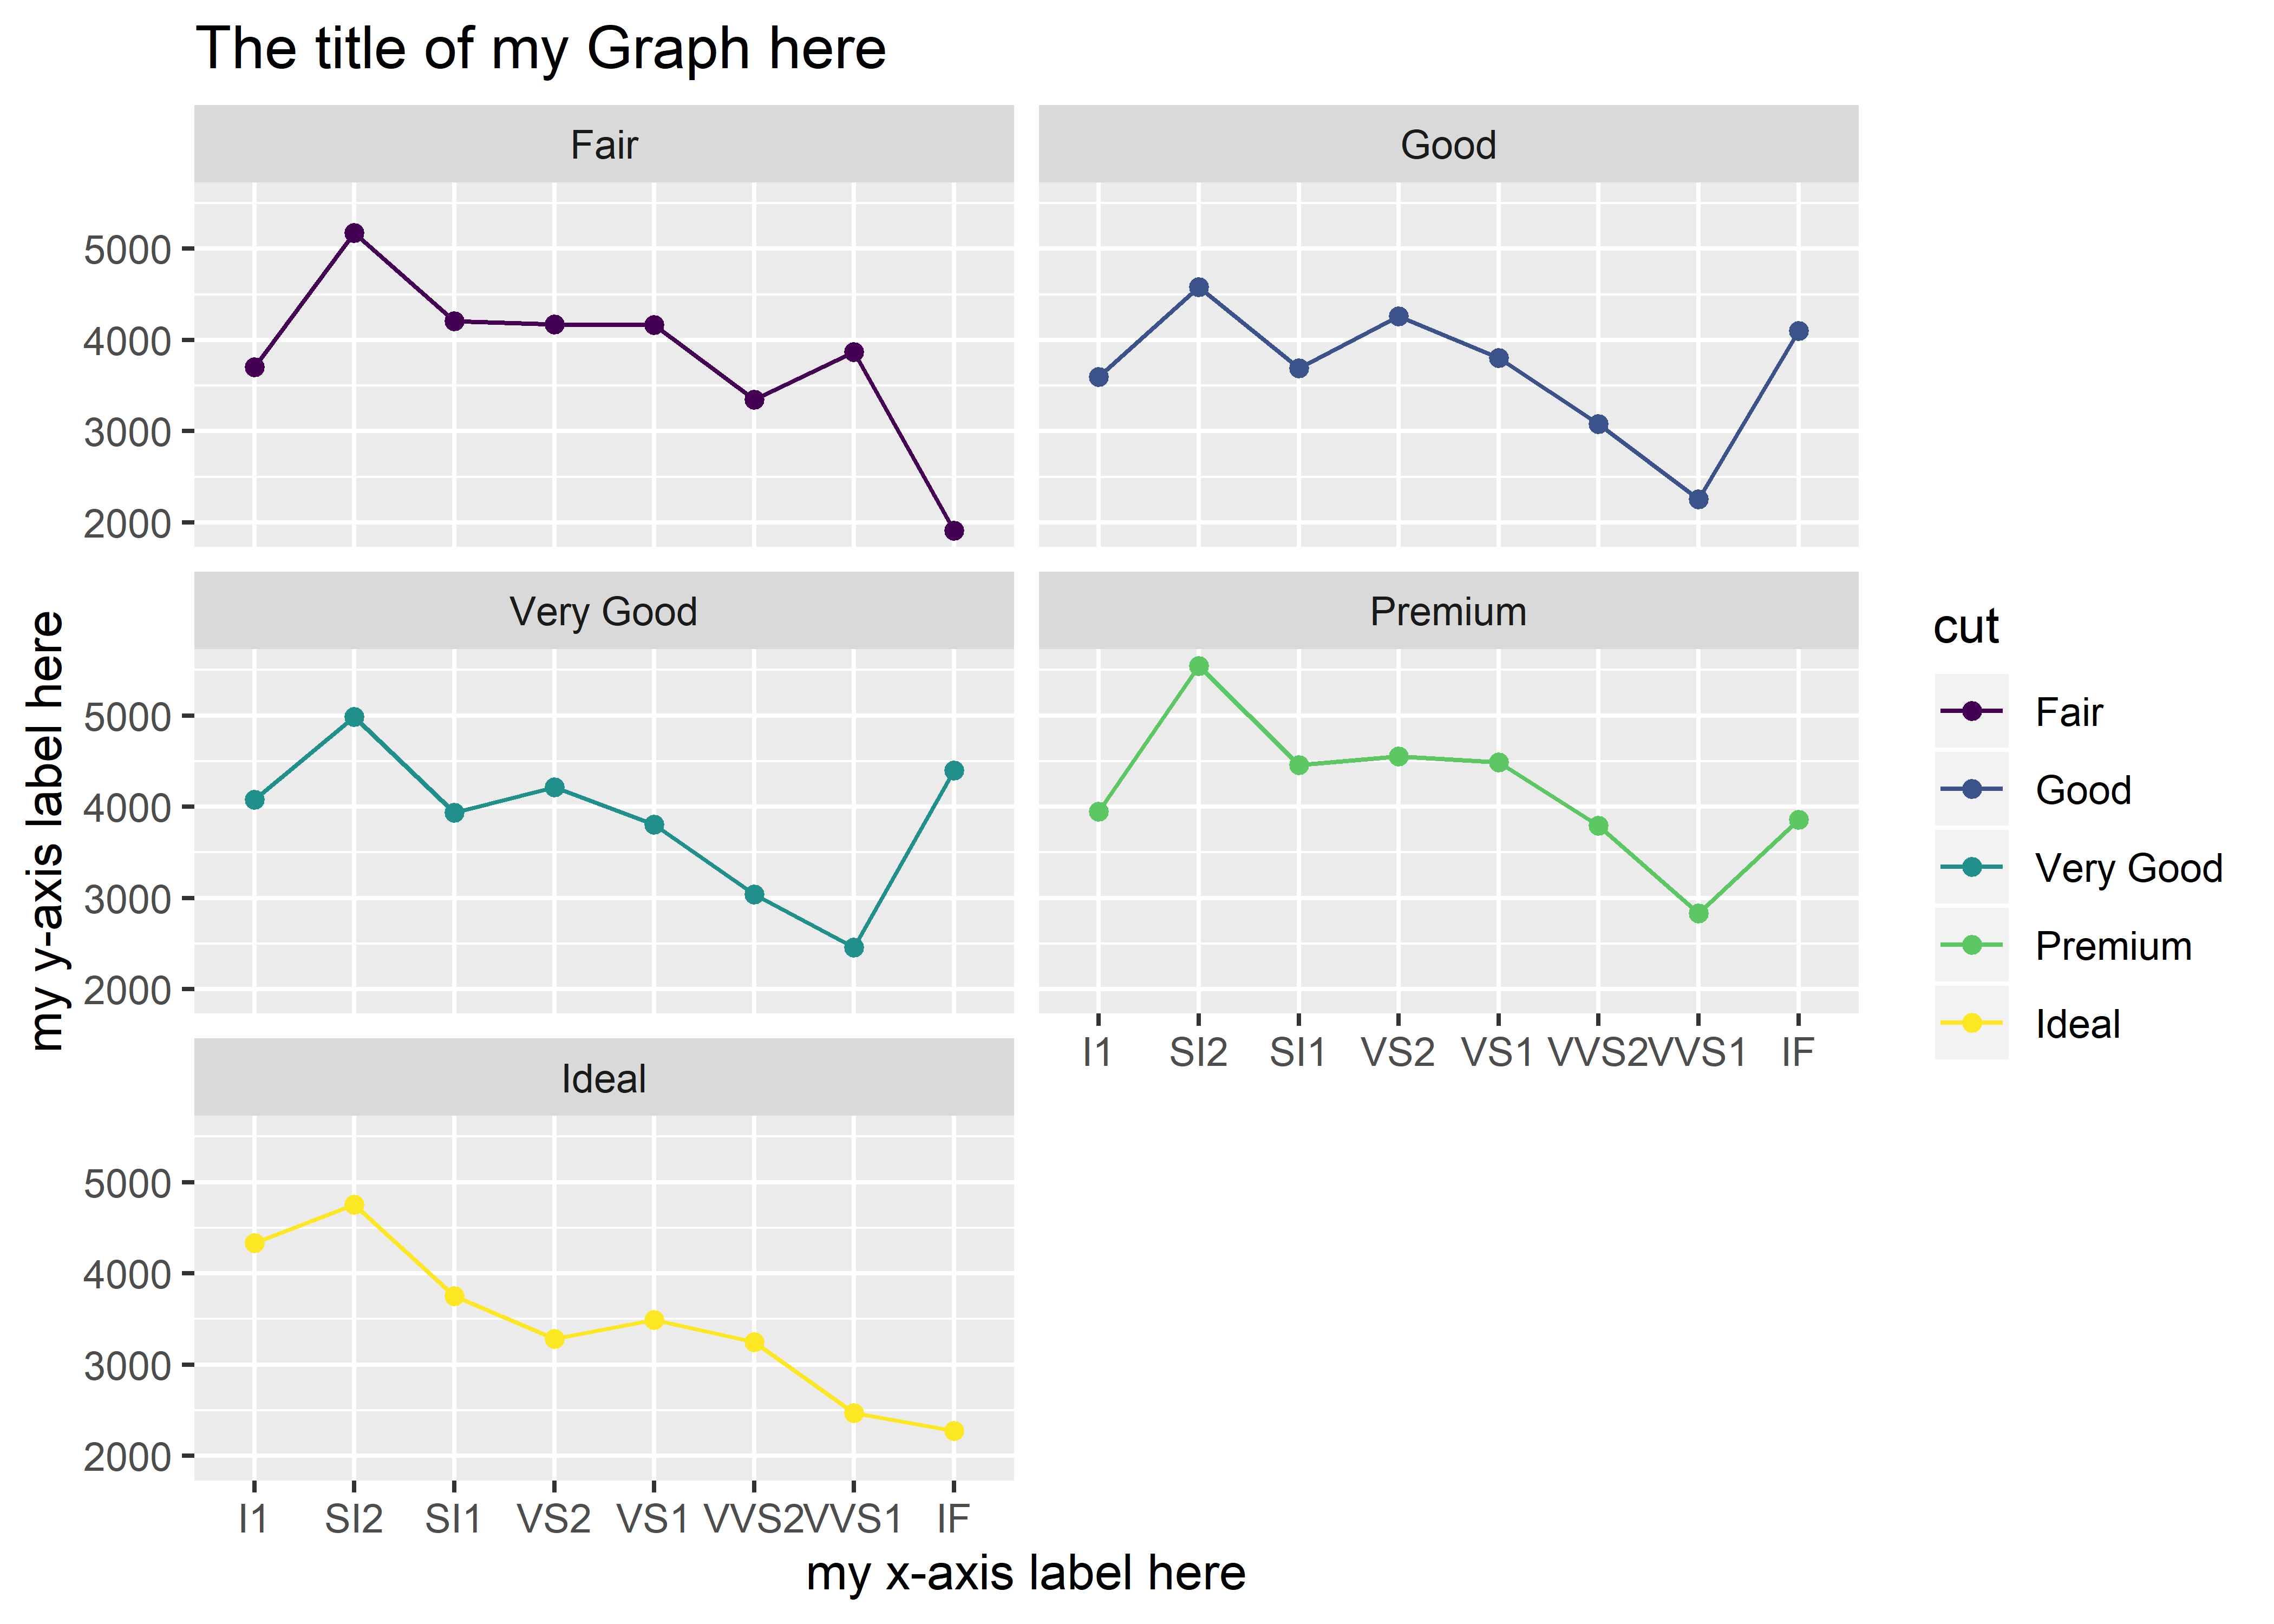
Labeling your graph with axes and main titles is a matter of adding another line to the code we’ve already built. You’ll notice that building a graph in R requires a command for each component. You must specify first that there is a graph (ggplot()), that there are data points on the graph (geom_point()), that there is a connecting line between the data points (geom_line()), that there are error bars (geom_errorbar()), and so on. The same principle applies to labels.
Using the ?labs help page, we see that the labs() function is the most versatile. You can specify multiple label components including: title, subtitle, caption, and tag. The help page also specifies that the x-axis, y-axis, and plot title can be separate arguments.
diamonds %>%
  group_by(clarity, cut) %>%
  summarize(m = mean(price)) %>%
  ggplot(aes(x = clarity, y = m, group = cut, color = cut)) +
  geom_point() +
  geom_line() +
  facet_wrap(~cut, ncol = 2) +
  labs(x = "my x-axis label here",
       y = "my y-axis label here",
       title = "The title of my Graph here")
Notice that the labels are sensitive to capitalization, where capitalizing “Graph” in will be reflected in the graph.
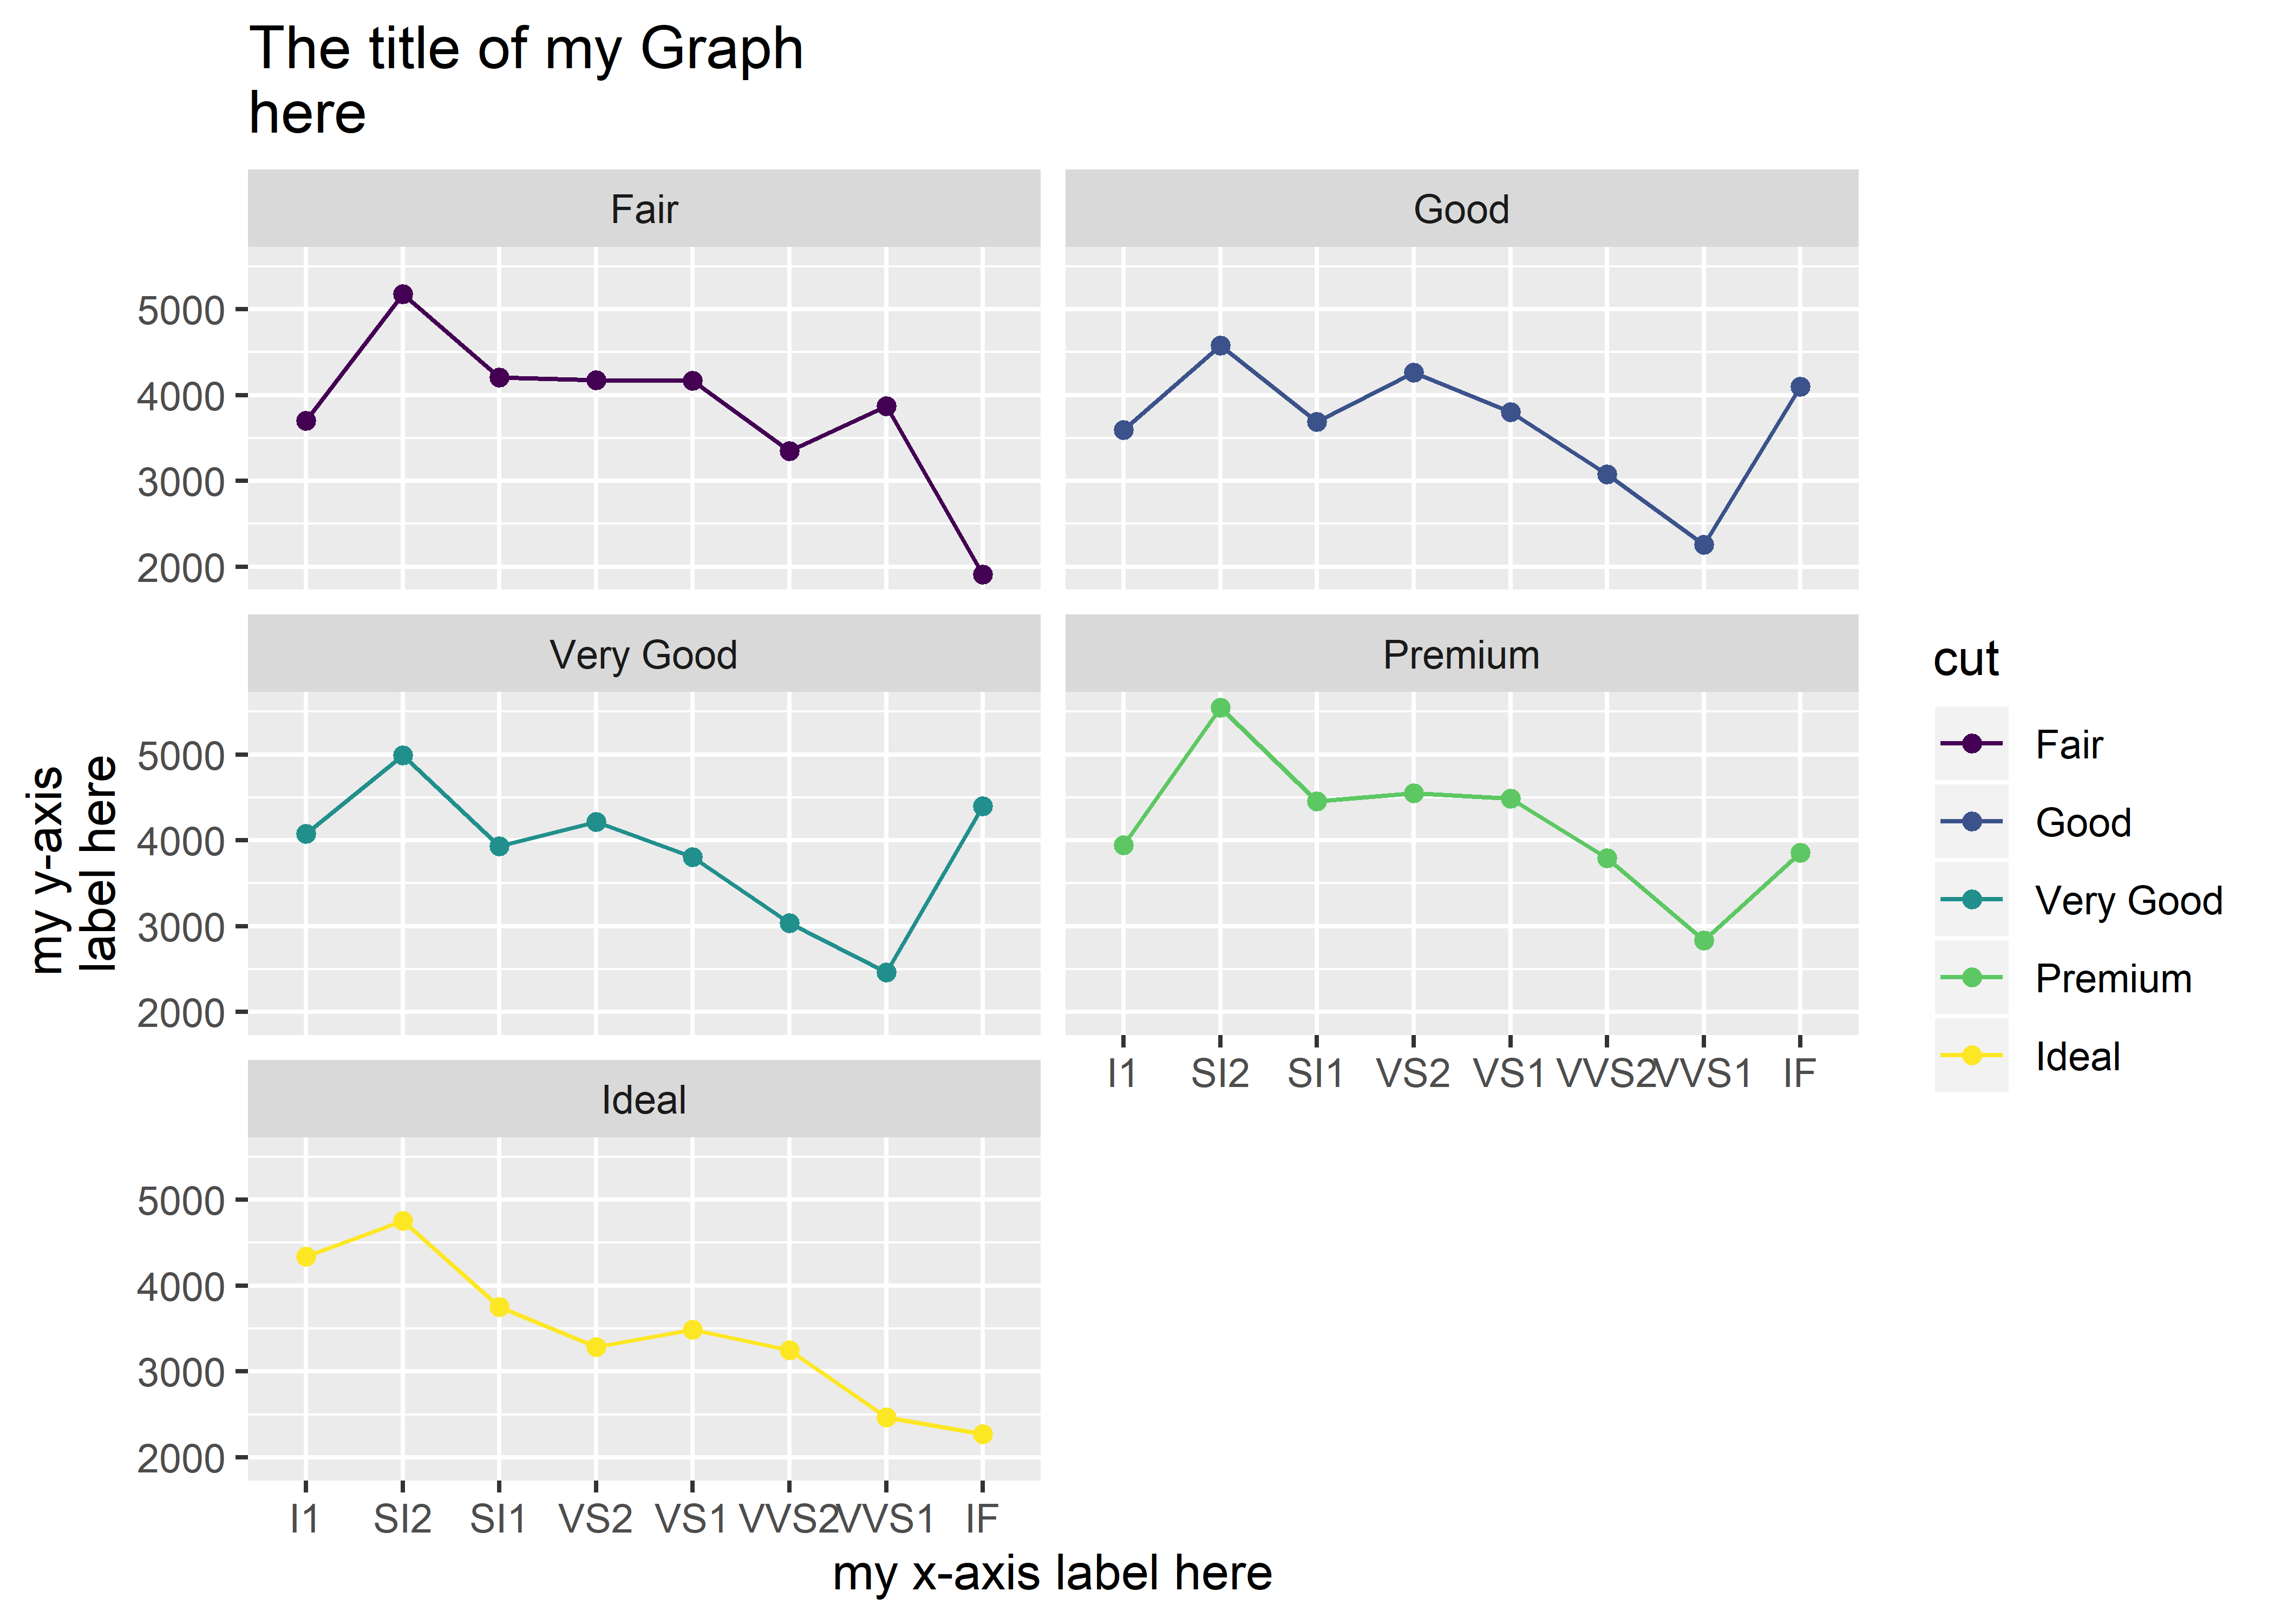
You include line breaks in your labels by using \n:
diamonds %>%
  group_by(clarity, cut) %>%
  summarize(m = mean(price)) %>%
  ggplot(aes(x = clarity, y = m, group = cut, color = cut)) +
  geom_point() +
  geom_line() +
  facet_wrap(~cut, ncol = 2) +
  labs(x = "my x-axis label here",
       y = "my y-axis \nlabel here",
       title = "The title of my Graph \nhere")
Although it may look awkward, \n must be placed precisely in front of the word that initiates the next line. For example, executing labs(title = "The title of my Graph \n here") with a space before the word “here” will introduce a space in the graph as well.
10.8.1 Exercises
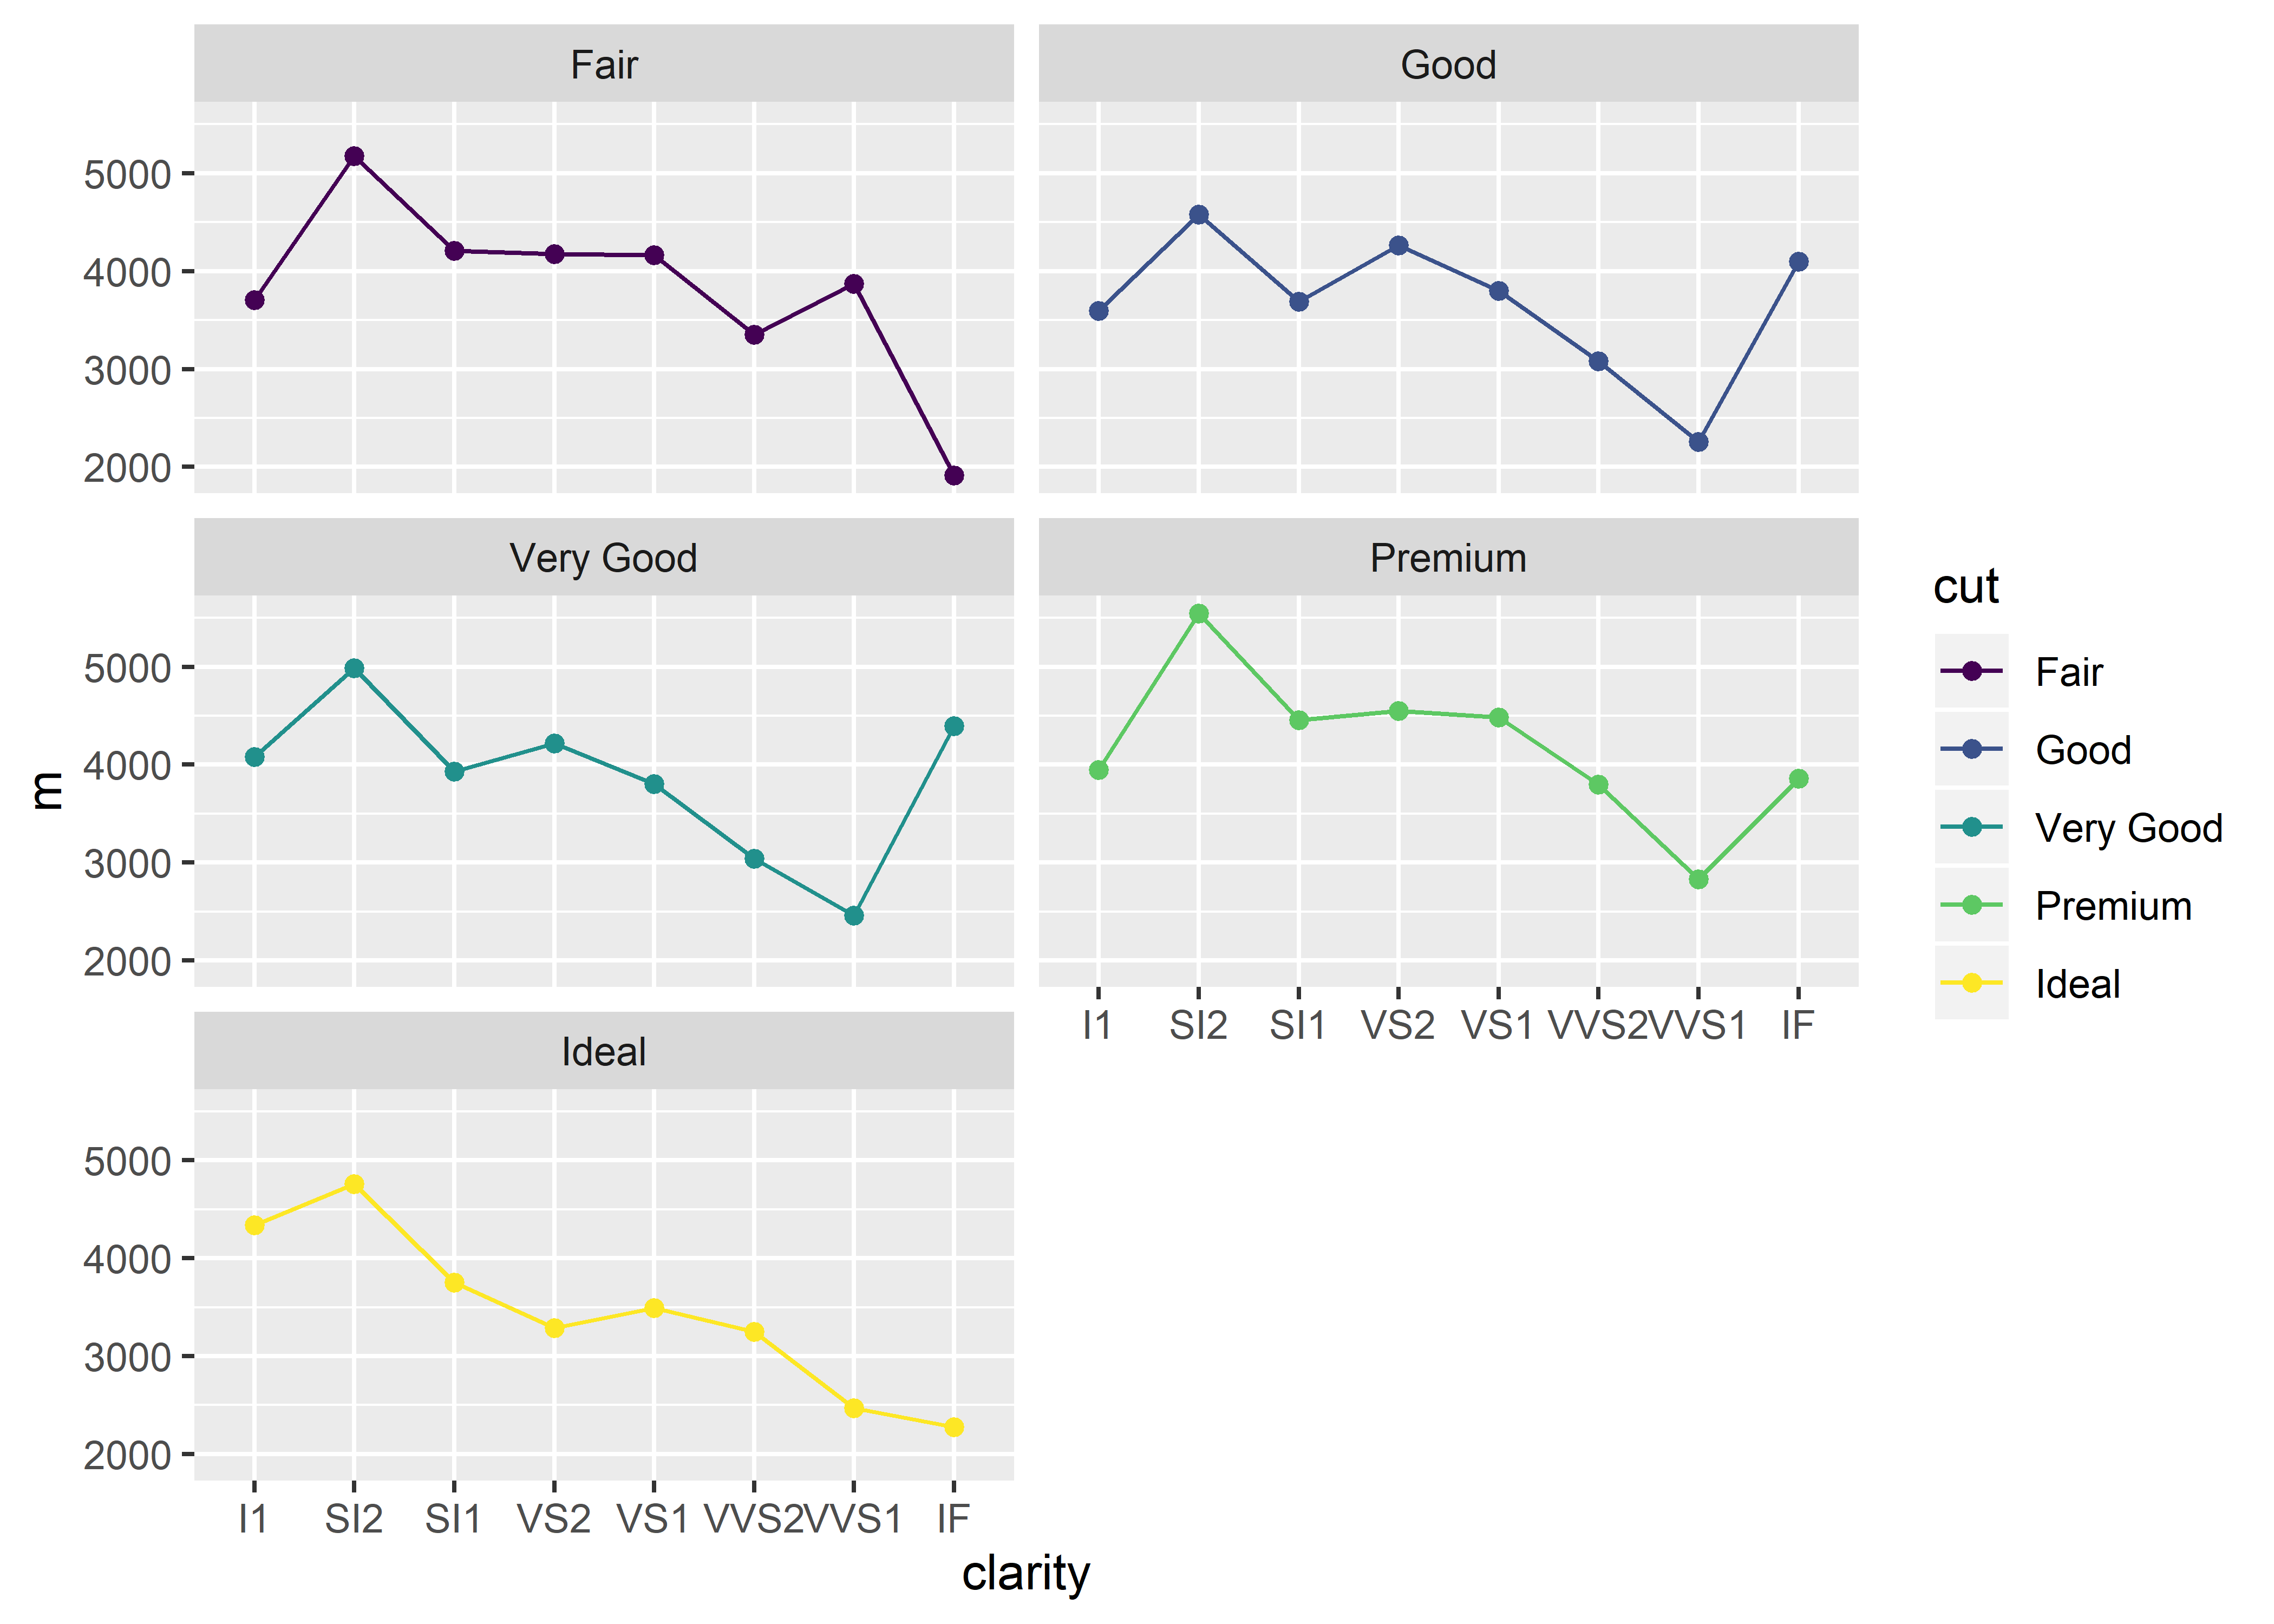
For each of these exercises, utilize the following base graph:
diamonds %>%
  group_by(clarity, cut) %>%
  summarize(m = mean(price)) %>%
  ggplot(aes(x = clarity, y = m, group = cut, color = cut)) +
  geom_point() +
  geom_line() +
  facet_wrap(~cut, ncol = 2)
Add the subtitle: “Here is a subtitle!” to the base graph (hint: requires
labs())Add the caption: “Here is my caption”
Add the tag: “Fig. 1A”
Add the tag: “C”
Add an x-axis, y-axis, title, subtitle, caption, and tag of your choosing to the base graph