%>%
diamonds
mutate()
summarize()
group_by()
ungroup()
filter()
select()
arrange()
count()
rename()
row_number()
ifelse()
stat_summary
tidyverse
aes
aes()
.csv
.xlsx
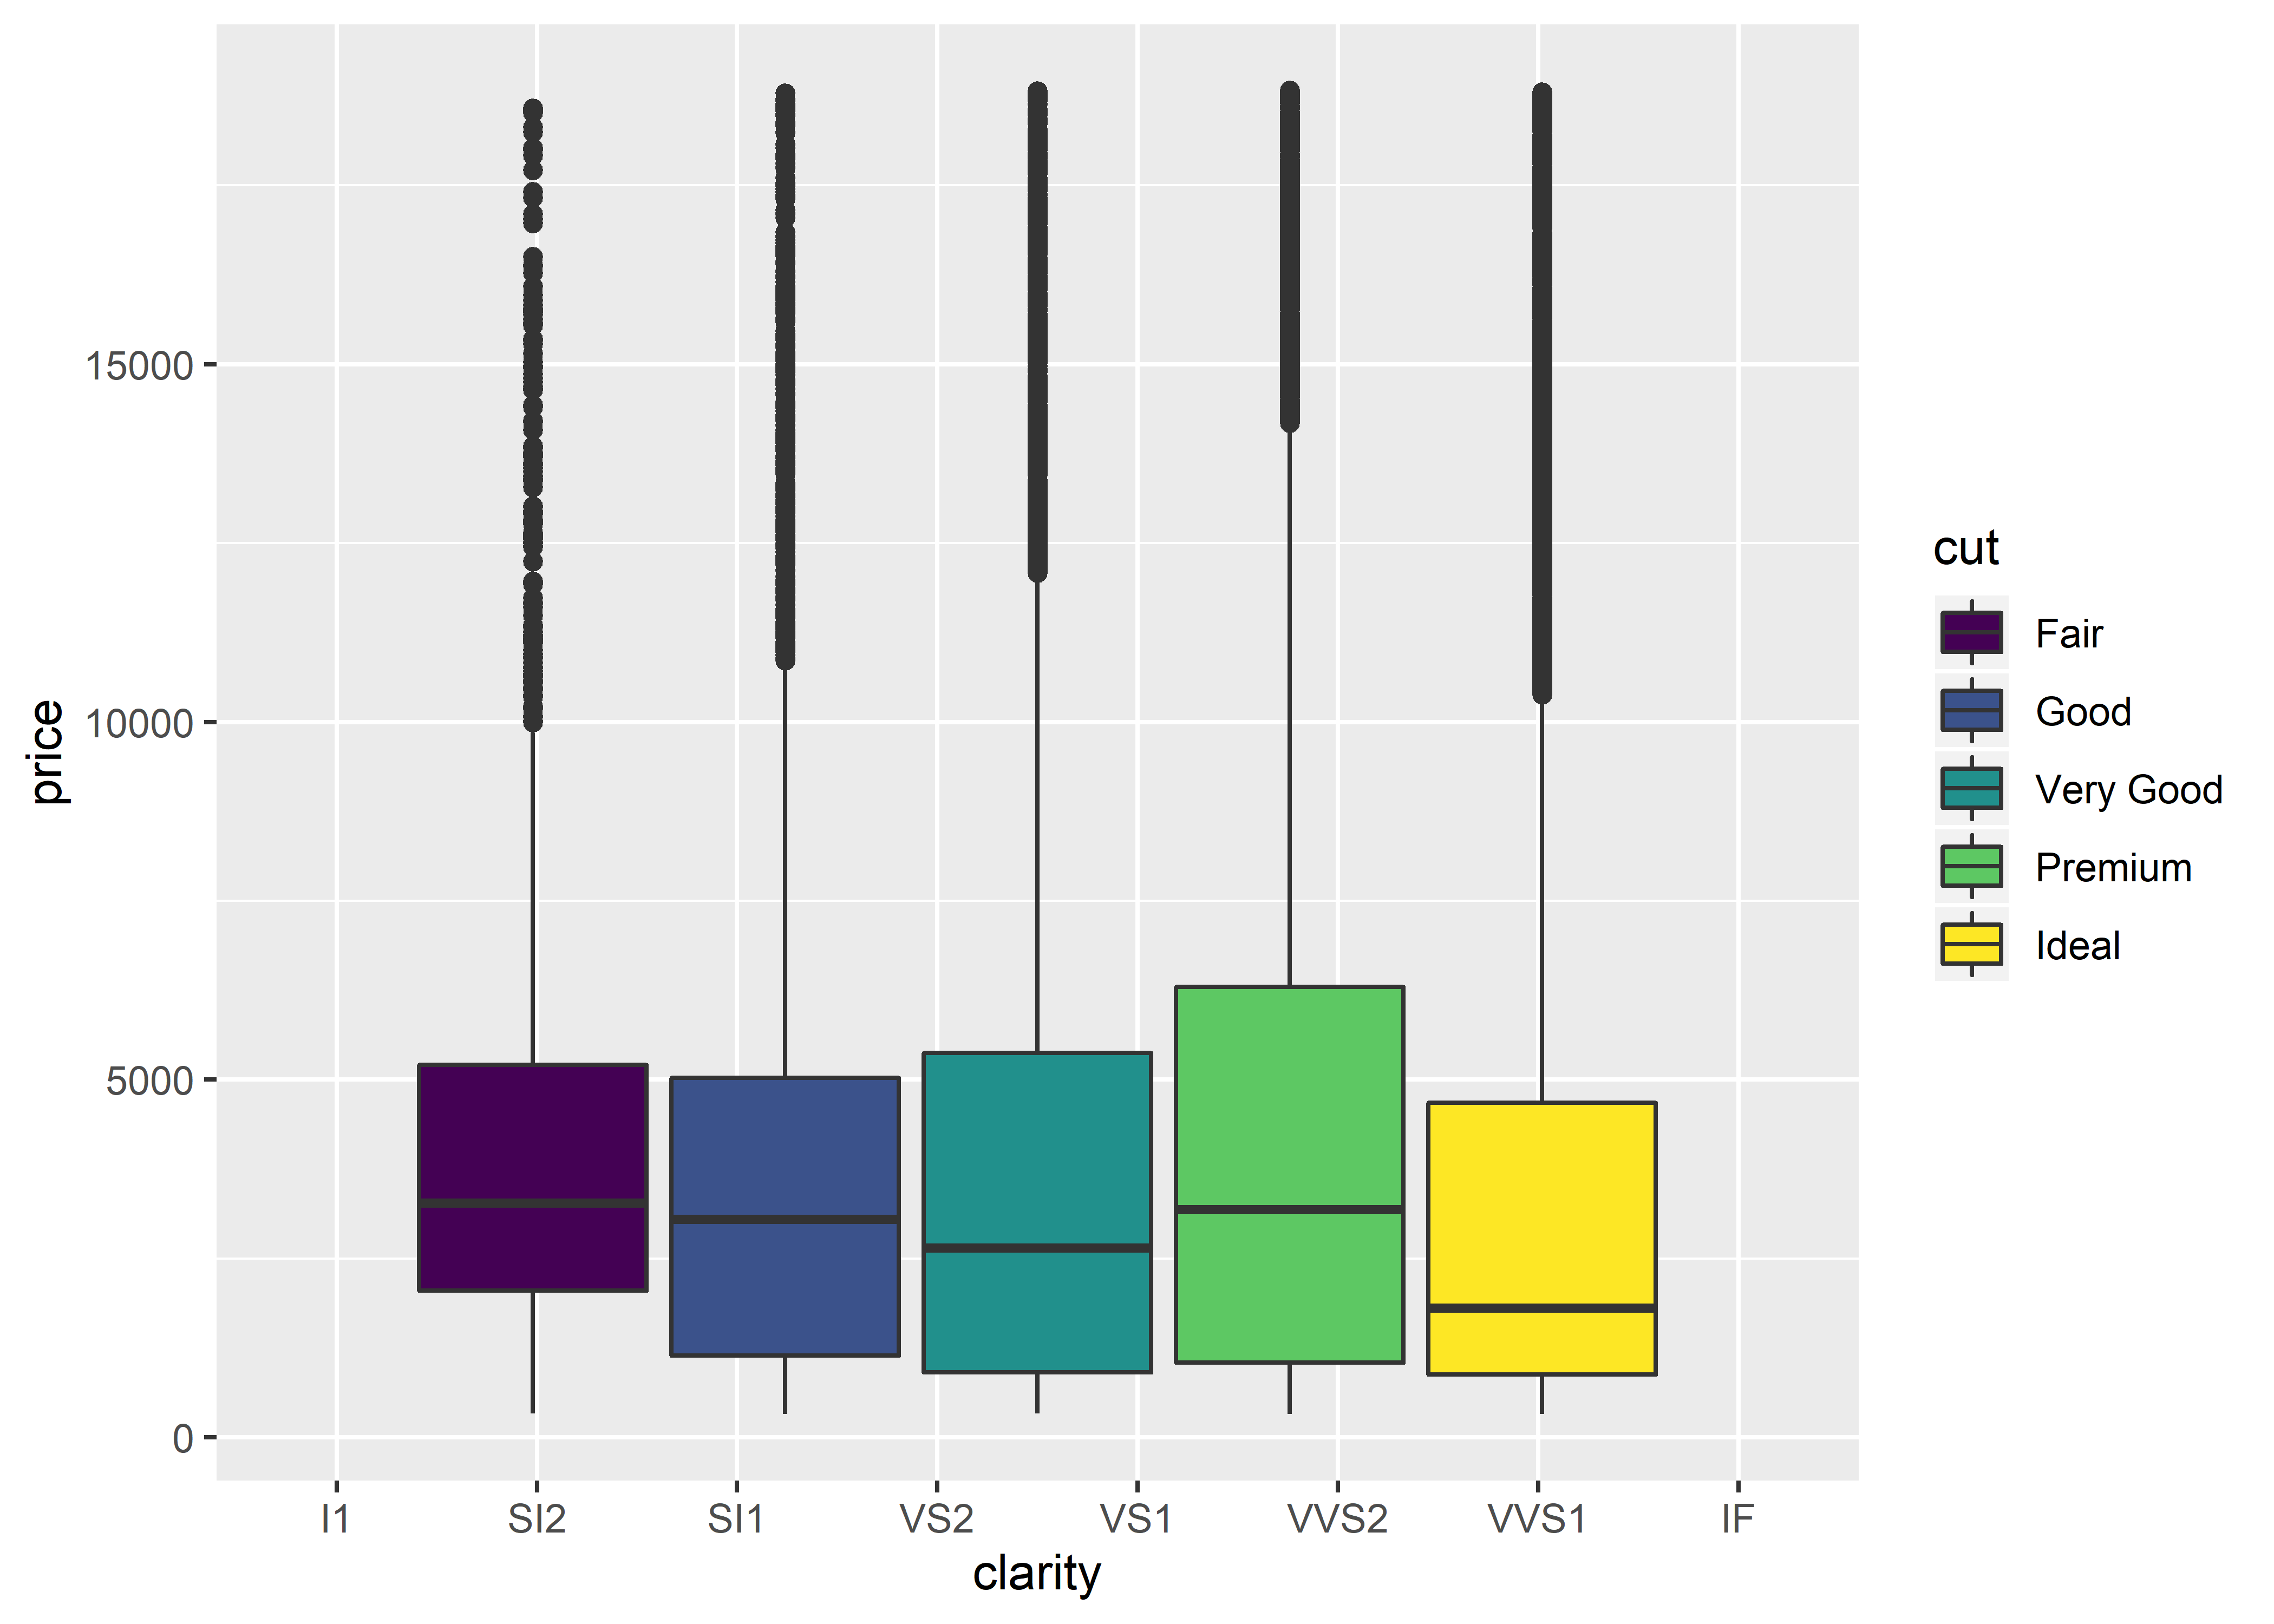
To graph a basic box plot, we use geom_boxplot():
geom_boxplot()
diamonds %>%
  group_by(clarity, cut) %>%
  ggplot(aes(x = clarity, y = price, group = cut, fill = cut)) +
  geom_boxplot()