Chapter 5 The diamonds dataset
Throughout this chapter, we will be working with the diamonds dataset, so let’s take a minute to familiarize ourselves with it. This built-in dataset is available when the ggplot2 package is loaded. Loading the tidyverse package will automatically load ggplot2.
Let’s view the diamonds dataset in a separate RStudio tab:
View(diamonds)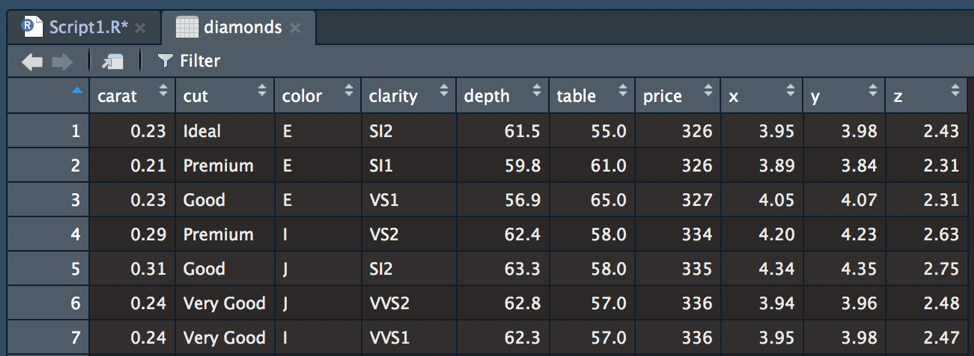
Figure 5.1: Viewing diamonds using View().
You can view any object in a new tab by wrapping the View() function around the object name. As a beginner in learning R, viewing the dataset in a familiar Excel-like format can be comforting. However, with more practice, viewing the dataset in this manner becomes less useful (especially when working with really big datasets). Unlike Excel, you cannot edit your data directly cell-by-cell in RStudio. Instead, every action must be explicitly specified in your code.
Next, let’s look at the structure of each variable in diamonds (see 3.3.10 for a refresher on structures):
str(diamonds)## Classes 'tbl_df', 'tbl' and 'data.frame': 53940 obs. of 10 variables:
## $ carat : num 0.23 0.21 0.23 0.29 0.31 0.24 0.24 0.26 0.22 0.23 ...
## $ cut : Ord.factor w/ 5 levels "Fair"<"Good"<..: 5 4 2 4 2 3 3 3 1 3 ...
## $ color : Ord.factor w/ 7 levels "D"<"E"<"F"<"G"<..: 2 2 2 6 7 7 6 5 2 5 ...
## $ clarity: Ord.factor w/ 8 levels "I1"<"SI2"<"SI1"<..: 2 3 5 4 2 6 7 3 4 5 ...
## $ depth : num 61.5 59.8 56.9 62.4 63.3 62.8 62.3 61.9 65.1 59.4 ...
## $ table : num 55 61 65 58 58 57 57 55 61 61 ...
## $ price : int 326 326 327 334 335 336 336 337 337 338 ...
## $ x : num 3.95 3.89 4.05 4.2 4.34 3.94 3.95 4.07 3.87 4 ...
## $ y : num 3.98 3.84 4.07 4.23 4.35 3.96 3.98 4.11 3.78 4.05 ...
## $ z : num 2.43 2.31 2.31 2.63 2.75 2.48 2.47 2.53 2.49 2.39 ...Here, we see that there are 10 total variables (three ordered factors, one integer, and 6 numeric). An added bonus of working with a built-in dataset is that documentation giving further descriptions and explanations is available via the help page (?diamonds).
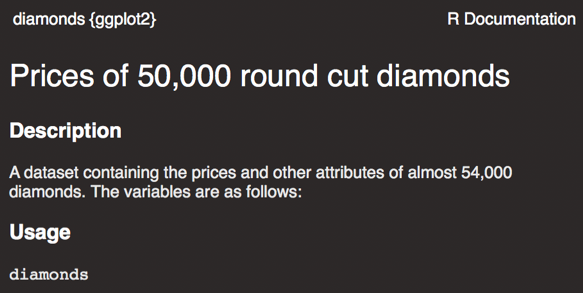
Here’s what we know about the diamonds dataset:
This dataset contains information about 53,940 round-cut diamonds. How do we know? Each row of data represents a different diamond and there are 53,940 rows of data (see help page,
?diamonds)There are 10 variables measuring various pieces of information about the diamonds. Notice that these variable names are in lowercase. We can take a quick view of the variable names using:
names(diamonds)There are 3 variables with an ordered factor structure:
cut,color, &clarity. An ordered factor arranges the categorical values in a low-to-high rank order. For example, there are 5 categories of diamond cuts with “Fair” being the lowest grade of cut to ideal being the highest grade.There are 6 variables that are of numeric structure:
carat,depth,table,x,y,zThere is 1 variable that has an integer structure:
price
Remember that R will always have documentation (in the help page; ?diamonds) for built-in datasets. The descriptiveness for the documentation will vary, depending on the package author.
| Variable | Description | Values |
|---|---|---|
| price | price in US dollars | $326-$18,823 |
| carat | weight of the diamond | 0.2-5.01 |
| cut | quality of the cut | Fair, Good, Very Good, Premium, Ideal |
| color | diamond color | J (worst) to D (best) |
| clarity | measurement of how clear the diamond is | I1 (worst), SI2, SI1, VS2, VS1, VVS2, VVS1, IF (best) |
| x | length in mm | 0-10.74 |
| y | width in mm | 0-58.9 |
| z | depth in mm | 0-31.8 |
| depth | total depth percentage | 43-79 |
| table | width of top of diamond relative to widest point | 43-95 |
Don’t forget that R cares about capitalization (diamonds is not the same as Diamonds and price is not the same as Price)!