10.10 Saving your Graph
Congratulations for getting this far! You now know the basics for creating an R line graph. An R graph can be saved in multiple ways.
10.10.1 Point and Click
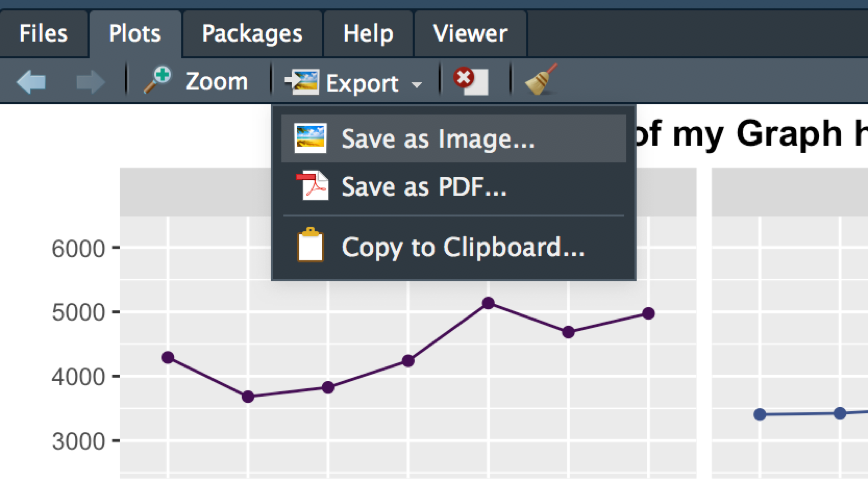
In the Plot tab of your bottom right pane, you can manually save each graph as they appear in the pane. This method will only save the graph that is currently displayed and is somewhat tedious when multiple graphs need to be saved at once.
10.10.1.1 Save via cairo_pdf()
The cairo_pdf() function is my ideal method of saving graphs to a pdf. It is compatible with both the Apple and Windows IOS (I use a Mac laptop and a Windows Desktop) and is the most user friendly (to date). In order to produce a pdf, the graphs need to be saved as objects in the environment:
Here, the graph is saved as an object named graph.facet:
graph.facet <- # saving this graph as an object
  diamonds %>%
  group_by(clarity, cut) %>%
  summarize(m = mean(price)) %>%
  ggplot(aes(x = clarity, y = m, group = cut, color = cut)) +
  geom_point() +
  geom_line() +
  facet_wrap(~cut, ncol = 2)
Next, I’ll let’s save second graph that we’ll name graph.plain:
graph.plain <-
  diamonds %>%
  group_by(clarity, cut) %>%
  summarize(m = mean(price)) %>%
  ggplot(aes(x = clarity, y = m, group = cut, color = cut)) +
  geom_point() +
  geom_line()
Now that we have both graph.facet and graph.plain saved as objects in our environment:
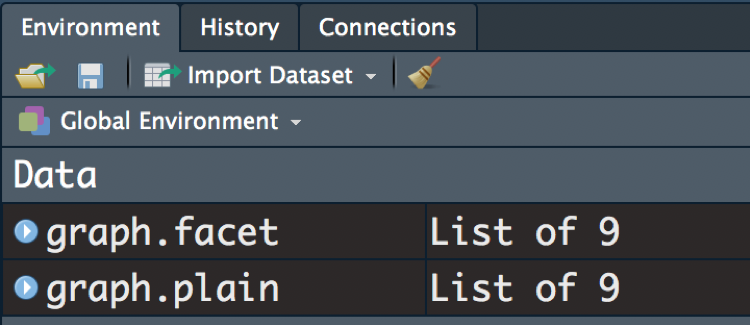
We can execute the following code all at once:
cairo_pdf(filename = "R Graphs Testing ",
          width = 11, height = 8, onefile = TRUE)
graph.facet
graph.plain
dev.off()
Here, I’ve named my PDF file “R Graphs Testing” and have specified the width and height of the document, which is currently set up to a landscape orientation for a standard letter-sized sheet of paper. If I want to switch the dimensions to yield a classic portrait orientation PDF, I would set width = 8 and height = 11. The onefile argument specifies that all of the graphs will be put into one file. If the code were onefile = FALSE, R would produce separate PDF files for each graph. It is imperative that you run all of these lines in succession. That is, executing the first line in the above example lets R know that you’re beginning to save objects to the PDF file. A temporary PDF file will be added to your working directory but will not contain anything. Once dev.off() has been executed, the PDF file will be saved and ready to view in your working directory. You may choose to add additional graphs or only save a single graph. Regardless, make sure those object names remain between the cairo_pdf() function and the dev.off() function.
After saving your graphs, I recommend inactivating all of the text which saves your graphs (highlight text from cairo_pdf() to dev.off() and hitting Ctrl + Shift + C). This prevents you from saving over a previous PDF. In fact, I recommend that a new file should be created each time you save a graph. This can be done by slightly altering the name of the file so that older versions of the file can be maintained should you need to revert to an older version. An easy naming alteration can be adding a new number after the title, such as “R Graphs2”, “R Graphs 3”, etc.
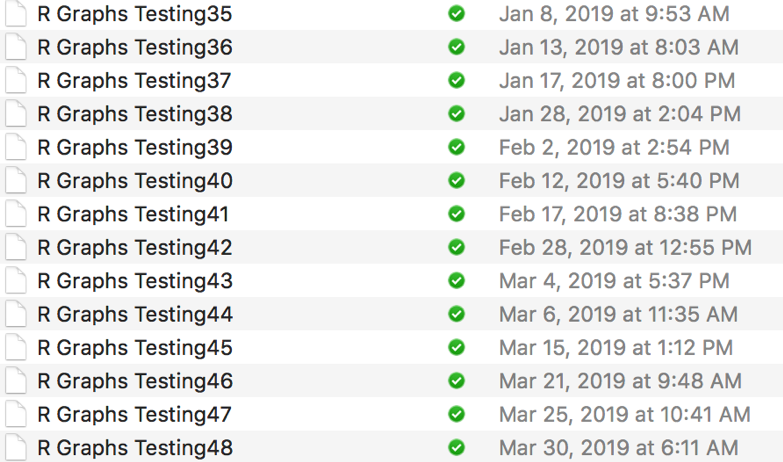
Figure 10.1: An example of version control for graph files. Each time the graphs are updated, a new PDF is created so that the older versions are still maintained.
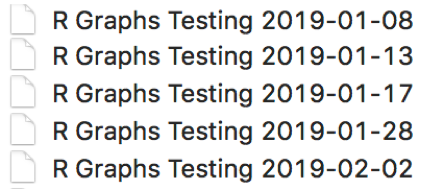
A more generalized method is to tag the file with the system date using the Sys.Date() function. This function specifies the current date in yyyy-mm-dd format, so it would be useful if you only saved one version per day (if you save these graphs more than once per day, it would be easier to use the numbers method mentioned earlier).
Adding a generalized tag such as this allows the user to update file names without the need for manual editing. That is, you wouldn’t have to manually enter “R Graphs2” and then “R Graphs3” the next time you saved. Manual editing can be prone to user error. If you forgot to change the number, you could accidentally save over the previous version. However, generalized labels may not always be worth the extra effort, particularly when multiple file copies are not necessary/desired.
To create a generalized label using Sys.Date(), execute:
cairo_pdf(filename = str_c("R Graphs Testing ", Sys.Date()),
          width = 11, height = 8, onefile = TRUE)
graph.facet
graph.plain
dev.off()
The str_c() function is used to concatenate strings. The filename argument in cairo_pdf() needs to be a string, so utilizing str_c() in this manner gives us a basic method for version control. Remember that strings can consist of any text you want, though my advice is to be as concise as possible and avoid use of symbols other than a space, dash(-), or underscore (_).
Try the following examples:
Execute
str_c("happy", "birthday")Execute
str_c("happy ", "birthday")(hint: notice the space after happy)Execute
Sys.Date()Execute
str_c("R Graphs", Sys.Date())Notice that
Sys.Date()is not within quotations. This is becauseSys.Date()is a named object with a string valueR Graphs cannot be executed because:
There is a space (AKA illegal character)
R Graphs is not the name of an object
R Graphsis a value
Notice that Sys.Date() does not have to be defined in the environment. This is because it is a built-in object. By default, R recognizes and has already defined some objects. Remember that it is not necessarily common knowledge to know all of the built-in elements of R. Programmers come to learn this kind of information through books that experts have written and “word-of-mouth” usually from reading a question on Stacked Exchange/an R forum.
Execute all of the following in succession:
fruit <- c(“orange”, “apple”, “banana”)fruitstr_c(fruit, "mango", "grapes")c(fruit, "mango", "grapes")
Again, notice that fruit is the name of an object while mango is a value. Remember that objects have to be defined by the user (with <-) or built-in by an R package.
Execute all of the following in succession:
week <- c("Mon", "Tues", "Wednes", "Thurs", "Fri", "Satur", "Sun")str_c(week, "day")c(week, "day")