1 What and why?
![]()
This chapter contains a lot of blabla and introduces one new tool.
The value of the blabla parts may not immediately be obvious.
Defining some key concepts of data science provides an abstract overview of the contents and goals of this book — not primarily in terms of technology and tools (e.g., R, RStudio, and R packages), but in terms of its key concepts (e.g., data, science, representations, and tools) and their relations.
A key notion is the theoretical concept of ecological rationality, which describes when and why tasks can be either easy or hard, depending on their fit to their environments and tools.
By contrast, the practical value of the tool will immediately be transparent: R Markdown is a solution to a problem called “literate programming”. By merging text and code in a single document and translating them into various output formats, it enables us to conduct reproducible research. So even if you skim or skip the blabla part, trying out the tool is likely to change your life.
Key concepts and issues
This chapter addresses and discusses the following questions:
- Basic terminology:
- What is data (e.g., its types and shapes)?
- What is science?
- What is data science (DS)?
- Which skills do data scientists need?
- What is the relation of DS to statistics?
- What is the relation of DS to computer programming?
- How can we do reproducible research?
- What is replicable vs. reproducible research?
- What is the ecological rationality of tools?
- What tools allow us to conduct reproducible research?
Important concepts discussed in this chapter include the terms data, representation, and science, and the notions of ecological rationality and reproducible research. The tool introduced to begin doing reproducible research is R Markdown, which allows us to combine computer code, text, and visualizations into a variety of documents.
Preparation
Recommended background readings for this chapter include:
Chapter 1: Prologue: Why data science? of Baumer et al. (2021)
Curriculum guidelines for undergraduate programs in data science (De Veaux et al., 2017)
Please note: You must not feel obliged to read those recommendations, but would find them enjoyable and helpful.
Preflections
Before you read on, please take some time to reflect upon the following questions:

Try defining the term data. How does it relate to information?
What is the difference between variables and values?
What is the difference between science and data science?
Which set of skills does a data scientist need?
What are key characteristics of a useful tool?
Which tools are you currently using for reading, writing, or calculating?
Why these and not others?What does the term reproducible research imply?
What kind of tools would we need to practice it?
Note: The purpose of these questions to help you adopt various perspectives and a reflective state of mind. Do no worry if they seem difficult or obscure at this point. Hopefully, some possible answers will become clearer by the end of the chapter. (Exercise 1.5.1 will ask you to summarize some in an R Markdown document.)
1.1 Introduction
Statistical thinking will one day be as necessary for efficient citizenship as the ability to read and write.
H.G. Wells (1903, paraphrased by S.S. Wilks, see link)
Why do we need data science? One argument begins with the insight that we need certain skills and mental capacities to cope with the complex demands of modern society. In reference to a person’s ability to read and write, this set of skills and capacities has been referred to as some sort of “literacy”: Whereas the terms statistical literacy and numeracy emphasize the ability of dealing with quantitative information, the term risk literacy emphasizes the ability of understanding risk-related information (e.g., the probabilities of events). We will use the term data literacy as an umbrella term that spans across all these concepts and additionally includes skills and tools for making sense of data.
Statistical thinking in medicine
The call for more data literacy is not a new phenomenon (see, e.g., Gigerenzer, 2002, 2014), as illustrated by the above quote from 1903 that is commonly attributed to the science fiction writer H.G. Wells. When looking for a domain that illustrates the desirability of a society with a high degree of statistical thinking or data literacy, our medical and health services are an ideal candidate. Over the past decades and centuries, rapid advances in biology and medicine have identified many risks and obstacles to healthy and fulfilled lives, as well as many means, habits, and cures for living better and longer. But the existing abundance of information and — often conflicting — advice on health and nutrition is often difficult to navigate and understand, even for experts.
If large portions of our population is challenged by health-related information, what about professionals in the medical sciences? Again, the problem has been identified quite a while ago:
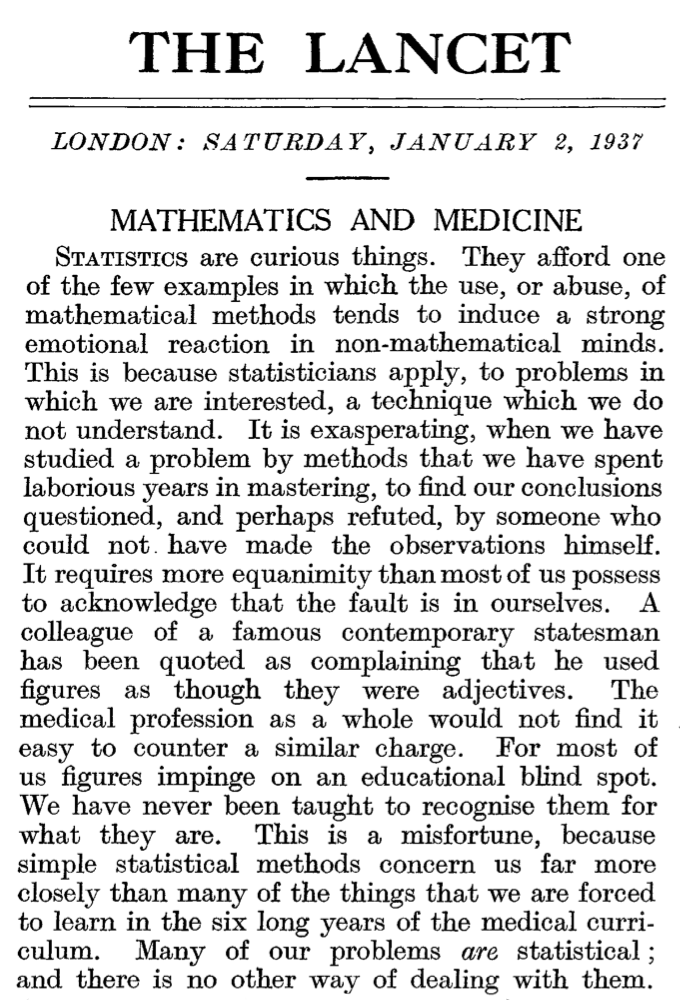
Figure 1.1: First sentences of an editorial in The Lancet (1937).
Figure 1.1 shows the first sentences of an anonymous editorial on “Mathematics and Medicine” that appeared in The Lancet (1937). Although this editorial is more than 80 years old, its verdict on the troubled relationship between mathematics and medicine still holds true today. And as every area of biological and medical research is getting more and more specialized, the gap between generating scientific insights and understanding them may even be widening.
But misunderstandings of numbers and statistics are not limited to biological and medical information. Other scientific areas that produce vast amounts of data with important implications for our present and future societies include all branches of the natural sciences (e.g., chemistry, physics, and climate research) and humanities (e.g., arts, economics, philosophy, and political sciences). Today, any news report is likely to contain a variety of scientific and numeric facts that a large proportion of its audience finds hard or impossible to understand. Decision makers in families, corporations, and countries are urged to take numeric information into account, but would find it difficult to understand and explicate how various quantitative measures were derived.
The term collective statistical illiteracy refers to the wide-spread inability to understand the meaning of statistical facts and numbers. Unfortunately, statistical illiteracy is ubiquitous not only in medical professionals, but also among experts from other fields (including scientists), and is more likely the norm, rather than the exception (see Gigerenzer et al., 2007, for examples). As a consequence, we have (at least some) politicians, parties, and societal groups that are or appear to be incapable of understanding basic facts and are unable or unwilling to make sound judgments on the basis of evidence.
Health illiteracy
In 2022, we are still plagued by a global epidemic — and vaccinations by statistical literacy do not seem as wide-spread as deadly viruses, dangerous ignorance, blatant lies, and self-serving distortions. Although the virus of COVID-19 and its variants pose a real threat, the wide-spread inability for understanding basic facts and health-related information is a force that — in combination with biases and increasing polarization of rival interests — erodes trust in scientific facts, public institutions, and the fabric of our democratic society. Again, this problem is not new and has been called by a variety of names. In 2009, The Lancet has identified health illiteracy as “the silent epidemic” (Editorial, 2009, p. 2028):
Referred to as the silent epidemic, health illiteracy is the inability to comprehend and use medical information that can affect access to and use of the health-care system. (…)
Although it is estimated that up to half of US adults have trouble interpreting medical information, the exact number is unknown because a reliable national health literacy measurement method is not available.Editorial of The Lancet (2009, Vol 374 December 19/26, p. 2028)
Given the availability of sophisticated health-care to a majority of people, the sad irony of health illiteracy in many highly-developed countries is that those services are “accessible to all but not understood by all” (ibid). Thus, health illiteracy is not a rare phenomenon and severely harms people in modern societies.
Ethical and legal issues
Beyond quantitative and technical skills, data literacy also involves an awareness and critical reflection of moral and legal issues. Questions like “Where does the data come from?”, “What can we do it?”, and “What are we allowed to do with it?” immediately raise critical legal and ethical issues that have important implications for our society and the access, participation, and representation of its members. As any inference drawn from data is always limited by the data it is based on, being aware of noise and biases in the data-generating process is a critical skill that precedes any data analysis.
Defining data literacy
A concise definition of data literacy is provided by Ridsdale et al. (2015) (p. 2):
Data literacy is the ability to collect, manage, evaluate, and apply data, in a critical manner.
While we agree that data literacy is “an essential ability required in the global knowledge-based economy”, and that “the manipulation of data occurs in daily processes across all sectors and disciplines” (ibid), our own definition is more explicit (by mentioning some preconditions), comprises both technical and reflective skills, and characterizes the desired outcomes:
Data literacy is the ability and skill of making sense of data.
This includes numeracy, risk-literacy, and the ability of using tools
to collect, transform, analyze, interpret, and present data,
in a transparent, reproducible, and responsible fashion.
From literacy to science
Most people would agree that a boost in data literacy would be desirable to strive towards enlightenment in a modern society. But how does this relate to the buzzword of data science? Well, decisions are usually based on data — and to enable successful decisions, somebody needs to gather and select data, analyze and process it in appropriate ways, and present the results in a transparent fashion. As data is a key building block of statistics and science, it seems desirable that the collection, transformation, and evaluation of data is conducted in a scientific fashion. The term “data science” and a corresponding scientific discipline raises new questions:
What is ‘data’? And what is ‘science’?
If ‘data science’ denotes a scientific field, what is its subject matter and scope?
Which skills and tools do data scientists need and use?
What could transparency mean in science? What with respect to some technology or tool?
1.2 Basic concepts
The bulk of this chapter gravitates around the concepts of “data” and “science”, and the interplay of “tasks”, “skills”, and “tools”. We will first reflect on the notions of “data” and “science” to obtain an idea of what “data science” could be. In other words, we explore different perspectives on the (pseudo-)equation
\(\rm{data} + \rm{science} \stackrel{?}{=} \rm{data\ science}\)
Beyond defining some terms, this serves to introduce key issues, but also to point out some implicit assumptions. Ultimately, we argue that successful data science involves a particular mindset, a variety of skills, and benefits immensely from transparent tools. An ideal fit between our tasks, skills, and tools — which we will describe as ecological rationality — renders tasks easy and intuitive and literally solves problems by making them disappear.
1.2.1 Data
The plural of anecdote is data.
Raymond Wolfinger (1969/70, see link)
What is data? Interestingly, we are entirely familiar with the term, but find it difficult to explain its meaning. We will first consider some candidate definitions and then reflect on the connotations evoked by the term.
Definitions
According to Wikipedia, data “are characteristics or information, usually numerical, that are collected through observation.” This is not very satisfying, as phrases like “characteristics or information” and “collected through observation” are quite vague and “usually numerical” allows for exceptions.
A second definition comes to the rescue: “In a more technical sense, data are a set of values of qualitative or quantitative variables about one or more persons or objects, while a datum (singular of data) is a single value of a single variable.” This sounds smart and may even be true, but the trick here is to delegate the definition to related concepts and hope that the person asking the original question will give up: If data are the values of variables, what are those?
An important aspect for understanding data is that the word is the plural of a singular datum, which is a Latin term for “something given”. Thus, the entity given denotes (or “represents”) something else. More explicitly, data consists of representations with a characteristic structure: Data are signs or symbols that refer to and describe something else.8 The data we usually deal with consists of written symbols (e.g., text) and measurements (e.g., numbers) that were recorded for some purpose.
For instance, if someone aimed to collect or compare health-related characteristics of some people, he or she would measure and record these characteristics in some file. In such a file of health records, some values may identify persons (e.g., by name or some ID code), while others describe them by numbers (e.g., their age, height, etc.) or various codes or text labels (e.g., their address, profession, diagnosis, notes on allergies, medication, vaccinations, etc.). The variables and values are typically stored in tabular form: If each of the table’s rows describes an individual person as our unit of observation, its columns are called variables and the entries in the cells (which can be referenced as combinations of rows and columns) are values. The contents of the entire table (i.e., the observations, variables, and values) are typically called “data”.
Note that the unit of observation (shown as the rows of our data file) does not always need to be an individual person. For instance, we could be interested in the characteristics of a region, country, or time period.
If the idea of some table stored as a file on some drive, server, or USB stick seems too mundane for your tastes, ask yourself about the “data” needed to describe a biological organism. What data are required to discover a new species? What are the data for or against human-made climate change? And what data is provided by the DNA of your cells? Although these appear to be lofty questions, collecting evidence to answer them requires translating various measurements or sensory signals (e.g., waves of sound or light) into numbers, words, diagrams, or maps. Collecting this information and creating displays for understanding and communicating it will typically involve some types of table with variables for some unit of observation. What is being measured and recorded crucially depends on the purpose (i.e., the question to be answered) and existing conventions (i.e., the field of investigation). Thus, the “data” is whatever we consider to be useful for answering our questions.
Practice
Rather than defining data, this section explicated the term by introducing some related notions (e.g., representations, variables, values). This is possible — and perhaps inevitable — as we are all familiar with the term and know how to use it in various contexts. Some related discussions in this contexts include:
The distinction between raw data (e.g., measurements, inputs) and processed data (results or interpretations): Data are often portrayed as a potential resource: Something that can be collected or generated, harvested, and — by processing — refined or distilled to turn it into something more valuable. The related term data mining also suggests that data is some passive raw material, whereas the active processing and interpretation of data (by algorithms, rules, instructions) can generate interest and revenue.
The distinction between data and information: In contrast to data, the term information has a clear formal definition (see Wikipedia: Information theory). And while data appears to be neutral, information is usually viewed as something positive and valuable. Hence, when data is being used and perceived as useful, we can generate insight, knowledge, or perhaps even wisdom from it?
The field of signal detection theory (SDT, see Wikipedia: Detection theory) distinguishes between signal and noise. Does data include both signal and noise, or should we only count the signal parts as data?
Note that all these distinctions attribute value to data in the context of some human interest.
The image of data
Irrespective of its definition, data appears to have a split personality.
On the one hand, data clearly has an image problem.
For many, the term ‘data’ sounds as cold and uncomfortable as ‘math’ or ‘homework’ — they may have their uses, but are perceived as dry and boring, and definitely not woke or sexy.
A somewhat nerdy and inhuman image of data is also evoked by the fictional character Data in the science fiction series Star Trek: The Next Generation (see Figure 1.2).
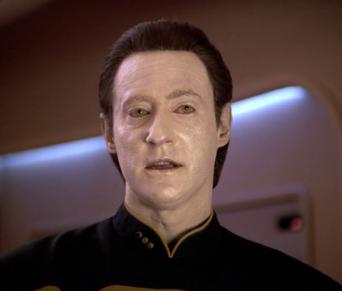
Figure 1.2: Data in the science fiction series Star Trek: The Next Generation. (Image from Wikipedia).
As Data is somewhere in between a human being and computer, his mix of quirky talents and limitations inspire both awe and alienation. To quote from Wikipedia: Data (Star Trek): “His positronic brain allows him impressive computational capabilities. He experienced ongoing difficulties during the early years of his life with understanding various aspects of human behavior and was unable to feel emotion or understand certain human idiosyncrasies, inspiring him to strive for his own humanity.”
Nowadays, the image of ‘data’ is not always portrayed in a negative or odd fashion. As retailers and tech companies are specializing in collecting and trading data, we are increasingly alerted to the value of data. In this context, the job of a ‘data scientist’ has been touted as the “sexiest job of the 21st century” (Davenport & Patil, 2012).
How can we explain this discrepancy? The basic idea of the more positive view is that data is a raw material or resource that can be used and exploited — and eventually turned into something more valuable. Thus, data science is the alchemy (see Wikipedia: Alchemy) of the digital age: Just like medieval scholars aimed to purify and transform base materials (like lead) into noble materials (like gold), modern data scientists aim to create value and insights out of bits and bytes.
An assumption underlying these efforts is that data is the foundation of various information types that can eventually be turned into knowledge and wisdom. Figure 1.3 shows their arrangement in a hierarchical structure of a DIKW pyramid:
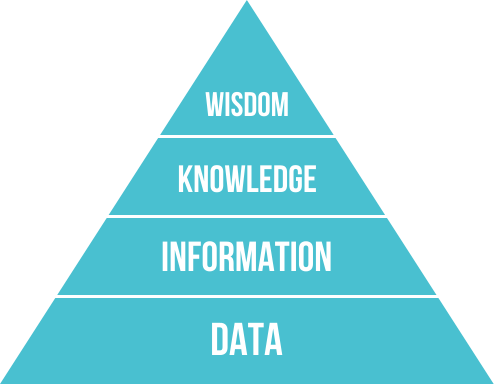
Figure 1.3: Data as the foundation of information, knowledge, and wisdom. (Image from Wikimedia commons).
Although it is difficult to explicate the distinguishing features of these terms, it is clear that data is more basic than knowledge, and that wisdom is both rarer and more valuable than data or information. The key distinction between the lower and the upper layers of the pyramid is that data needs to address some hypothesis or answer some question, and has to be interpreted and understood to become valuable. Thus, the data’s use or usefulness determines whether we are dealing with junk or gold. Analytically, the transition from data to information, knowledge, or wisdom, is a matter of perspective. In practice, all layers of the pyramid mutually support and complement each other: Using data in a smart and systematic fashion requires a lot of knowledge, skill, and wisdom; and successfully interpreting and understanding data informs and transforms our knowledge and wisdom.
Another reason for the close interaction between data and theory is that we need theoretical models for understanding and interpreting data. When analyzing data, we are typically interested in the underlying mechanisms (i.e., the causal relationships between variables). Importantly, any pattern of data can be useless and misleading, when the data-generating process is unknown or ignored. Knowledge or at least assumptions regarding the causal process illuminate the data and are required for its sound interpretation. The importance of theoretical assumptions for data analysis cannot be underestimated (see, e.g., the notion of causal models and counterfactual reasoning in Pearl & Mackenzie, 2018). Thus, pitting data against theory is nonsense: Using and understanding data is always based on theory.
Practice
Where else does the term ‘data’ appear in textbooks, news, and media reports? Which connotations and evaluations are evoked by the term?
-
Rather than defining data, perhaps we can distinguish between a wide and a narrow sense of the term:
wide sense: Any signal or phenomenon that can be measured, recorded, or quantified.
narrow sense: Encoded information, serving someone’s interest(s).
Does this capture your understanding of the term? Or is the wide sense too wide and the narrow sense too narrow?
Representations
Above, we used the term representations to capture the characteristic structure of data: Data is “something given” that denotes or describes something else. A more abstract way of expressing this is that a key property of representations is their intentionality or aboutness: They are things that represent something else (see the related notions of signs and symbols).
One way to better understand data is by studying the properties of representations. Representations are the symbolic or physical instances of data. Despite the abstract term, representations are concrete: To become manageable and manipulable, data needs to be represented (e.g., as categories, numbers, or words).
A key insight when dealing with representations is that the assignment relation between some concept (e.g., a number) and its representation is somewhat arbitrary. And as different representations have different properties, it matters how information is represented. To illustrate this point, Figure 1.4 shows how different numeral systems represent the numbers 1 to 12 (from De Cruz et al., 2010):
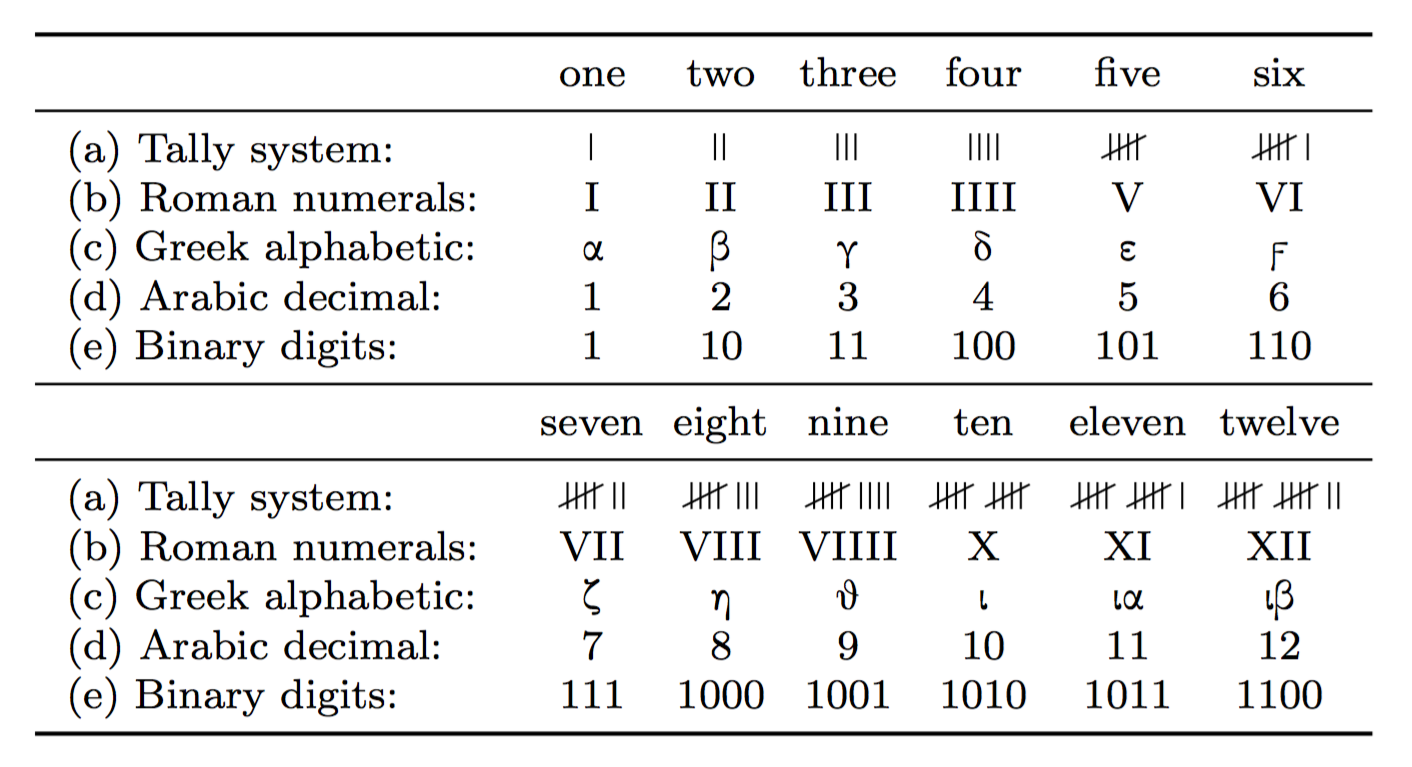
Figure 1.4: Different representational systems to represent numbers (from De Cruz et al., 2010, p. 61).
Figure 1.4 shows five different symbolic representations of the number ‘one’. Note that it would be easy to think of additional ways to represent the same number. For instance, “uno”, “eins”, and “egy” represent the same number in different languages. Interestingly, both the Arabic and binary representation show a single digit 1, but both representations still are different. For instance, adding 1 + 1 requires different symbolic operations in both systems.
In addition to using different symbols, different representations require different operations. This becomes obvious when calculating in different representational systems. Whereas it may seem relatively easy to compute the sum of 3920 + 112, we find it rather difficult to add up MMMDCCCCXX + CXII. A lot of this impression is based on familiarity: We have extensive experience with the Hindu-Arabic system, as opposed to Roman numerals. Actually, adding 3920 + 112 in base-10 requires non-trivial carrying operations that are no needed in the Roman system, which only requires a super-set of all symbols and simple replacement rules (see Schlimm & Neth, 2008). Thus, while adding and multiplying with Roman numerals seems difficult to people with our experience, it is actually quite simple. However, beyond the effects of familiarity, different representations also require different trade-offs (e.g., between external and internal operations). For instance, using Roman instead of Hindu-Arabic numerals requires less memory capacity for numerical facts, but many more symbols.
The following sections introduce additional terms that further describe or distinguish aspects of data and representations.
Variables vs. values
Not all representations are created equally. Instead, variables denote categories or types, and values are instances or tokens of a variable. When dealing with representations, the distinction between a variable and its values can be expressed as follows:
A variable is a dimension or property that describes a unit of observation (e.g., a person) and can typically assume different values.
By contrast, values are the concrete instances that a variable assigns to every unit of observation and are further characterized by their range (e.g., categorical vs. continuous values) and their data type (e.g., a logical, numeric, or character value).
For instance, an individual can be characterized by the variables name, age, and whether or not s/he is classified as an adult.
The values corresponding to these variables would be of type text (e.g., “Lisa”), numeric (e.g., age in years), and logical (TRUE vs. FALSE, defined as a function of age).
Although it is possible that a single variable contains values of different data types (e.g., a variable age could include “18”, “eighteen”, “is_adult”), it often makes sense that variables contain only values of a single data type.
In scientific contexts, variables are often defined as numeric measures and computed according to some rule (e.g., by some mathematical formula) from other variables. For instance, the positive predictive value (PPV) of a diagnostic test is a conditional probability \(P(TP|T+)\) that can be computed by dividing the test’s hits (e.g., the frequency count of true positive cases, \(TP\)) by the total number of positive test results (\(T+\)). Given its definition (as a probability), the values for the variable PPV vary continuously in the range from 0 to 1.
Signaling representation-talk
One difficulty in addressing the properties of representations is that we cannot do so without using representations. For instance, language usually uses words (i.e., a type of representation) to refer to things, but can also talk about representations. In written language, we can use quotation marks or emphasis to indicate that we are talking about a word, rather than use it in its ordinary meaning. For instance,
- The variable
ageis numeric. - The word “rhythm” is difficult to spell.
- The word word is a four-letter word.
Types of data
As variables and values depend on what we want to measure (i.e., our goals), it is impossible to provide a comprehensive list of data types. Nevertheless, computer scientists typically categorize data into different types. This is made possible by distinguishing between different ways in which data is represented. The three most basic types of data are:
-
Truth values (aka. logicals): either
TRUEorFALSE - Numbers: e.g., \(2, \frac{1}{2}, \sqrt{2}\)
- Text (aka. characters or strings): e.g., “Donald Duck” or “War and Peace”
Most computer languages have ways to represent these three elementary types. Exactly how truth values, numbers, or text relate to the actual phenomena being described involves many issues of representation and measurement.
In addition to these three basic data types, there are common data types that have precise and widely-shared definitions, like
-
dates and times: e.g., 2026-01-14,
11:55 - locations: e.g., the summit of Mount Everest, or N40\(^{\circ}\) 44.9064’, W073\(^{\circ}\) 59.0735’
but even more potential data types that we could define, if we had or wanted to, for instance
-
temporal terms: e.g.,
Monday,noon, ortomorrow - visualizations: e.g., a bar chart, or Venn diagram
As we can express more complex measures in terms of simpler ones (e.g., as numbers or by some descriptive text), we can get quite far by combining our three basic data types (e.g., dates, times and locations can be described as combinations of characters and text).
Shapes of data
Beyond distinguishing data types, we can also ask about the shape of data or representations. While it gets challenging to answer questions like “How is the number 2 represented in the brain?” or “What is the shape of yellow?”, we can simplify our lives by asking: “In which shape do computers represent data?”.
In Chapters 2 and 3, we will encounter three basic shapes of data:
-
scalars: e.g., 1 or
TRUE - 1-dimensional vectors and lists: e.g.,
1, 2, 3or'x', 'y', 'z' - 2-dimensional matrices: e.g., a table of health records for different people
Just as for data types, we can easily extend these basic shapes into more complex data formats, like
- n-dimensional arrays, e.g., the number of Titanic passengers by
age,sex, andsurvival
- non-rectangular data, e.g., a list of sentences, what someone did last summer
Representational isomorphs
Rather than aiming to provide a comprehensive list of data types and shapes, a key insight that will be re-iterated throughout this book is:
- The same data can be represented in many different types and shapes.
The term representational isomorph tries to capture instances in which the same thing is represented in different ways. While the term sounds complicated, the phenomenon is familiar (e.g., we noted above that 2, II, and “two” are three ways to represent the same number).
The existence of representational isomorphs does not imply that the details of a representation are irrelevant. We have already seen above that it does matter whether we represent numbers as Hindu-Arabic or as Roman numerals. Precisely how the types and shapes of representations matter is an active area of study in mathematical philosophy and computer science. The key reason for rendering any general answer impossible is that our success in dealing with a particular representation depends on interactions in a wider context. Below, we will establish the term ecological rationality to characterize a correspondence between our goals and tasks, our capacities and tools for manipulating representations, and the wider context in which our tasks are taking place.
Tasks generally appear simple or “intuitive” when representations match or fit to our tools. A practical consequence of this is that we often need to change the way in which some data object is being represented. When representing information in computers, we often need to re-code some data object into another type or form. These operations are called encoding or translating (when primarily changing data types) and reshaping or transforming (when primarily changing data shapes). Even more general umbrella terms for different kinds of transformations are data moves (Erickson et al., 2019) or data wrangling.
On a very general level, data science essentially transforms data so that the answer to a question or the solution of a problem becomes obvious (see Simon, 1996). But rather than dwelling on this really profound, but also somewhat obscure insight, let’s address the second term in “data science”.
1.2.2 Science
Having explored the notion of data, we can ask: What is science? Although we may usually not struggle with this term, it is difficult to provide a precise definition for it. One reason for this is that many people habitually mix the term with their evaluation of what they perceive as a “scientific view” or “the scientific establishment”. Regardless of whether this verdict is positive or negative, we should not confuse science with its evaluation. A good way to gain a better understanding of science consists in contrasting it with pseudo-scientific efforts that proliferate in our societies.
A parody of science
Today, many people are highly skeptical and suspicious of what they are being told. To gain a critical distance from so-called “fake news” they set out to seek the truth for themselves — and may even discover “alternative facts”. Being curious and inquisitive are often welcome indicators of concern and intelligence. Rather than believing what experts, politicians, or the media are saying, skeptics engage in research by searching for information. And instead on merely relying on their own observations and opinions, they verify them by asking other people for their views. This process features many hallmarks of scientific research, but often nurtures superstitions, conspiracy theories, and plain nonsense.
But what exactly can be unscientific about a search for evidence? The key problem with pseudo-scientific beliefs is not so much their content, but their motivation and methodology. To understand this, a good question to ask any self-proclaimed researcher is: “Which evidence or fact would disprove your hypothesis?” If the answer is: “Nothing”, the person is not willing to change his or her views in the face of new discoveries. But if an insight cannot be changed by evidence, we might as well abandon our search for information and simply accept all corresponding claims.
Proponents of pseudo-scientific theories are often not denying that facts are important and relevant. Actually, they often offer “alternative facts” and even mimic scientific theories (e.g., by pointing out some phenomenon’s complexity or poorly understood mechanisms) and processes (by simulating research and the collection of evidence). What separates these actions from actual science is a tendency of filtering acceptable evidence or a motivated methodology (i.e., a selective or biased way of collecting and processing evidence). Interestingly, the people most loudly insisting on “alternative facts” seem to rely primarily on those that appear to confirm their pre-existing opinions. Similarly, someone’s search for “alternative opinions” is often limited on a small social circle of like-minded people. The general phenomenon that someone’s search for and selection of information sources is filtered by evaluations and designed to support a desired result is called confirmation bias (Nickerson, 1998). When people only accept facts that match their pre-existing perspectives or interests, but censor and discard everything else, all our warning lights for pseudo-science should light up.
Whereas pseudo-science mostly serves someone’s preferences, actual science crucially depends on good data, the correct application of sound methods, and a fair evaluation of the evidence. As any of these components is prone to errors, scientists also struggle with conflicting evidence and can only aspire towards an ideal of neutrality (while any hypothesis builds upon assumptions). While there are substantial disagreements within science, these disagreements pre-suppose a wide consensus on what counts as evidence and which methods are suitable to settle controversies. Thus, we must not confuse scientific disputes with the parody of science orchestrated by people with an agenda for sowing disorder or promoting their own (often commercial, ideological, or political) interests.
A useful technical term for the masquerade of science and “findings” based on biased evidence accumulation is bullshit (BS, see Frankfurt, 2009, for a discussion). Beyond its illustrative potential, a core aspect of BS is its blatant lack of concern for truth or finding out the truth. Essentially, a person or institution serving BS cares less about sound methodology or the validity of evidence than for promoting their own goals, preferences, and the effects of their statements. BS is typically both fake and phony — it fakes something by not providing helpful answers and is phony by aiming to conceal this shortcoming.) Unfortunately, polluting our world with BS is far easier than cleaning up the mess — a fact that has been elevated to the status of a principle (see Bergstrom & West, 2021, p. 11):
The amount of energy needed to refute bullshit
is an order of magnitude bigger than [that needed] to produce it.Alberto Brandolini (2014)
Although data is not the same as information and any collection or analysis of data can also be manipulative and misleading, boosts in data literacy and data science are more likely to be part of the answer than of the problem. To understand the question to which data science provides an answer, we need to briefly consider the nature of science.
Actual science
Having described a parody of science that simply denies anything that fails to fit with a pre-determined attitude or worldview, we can characterize proper science by its profound concern for the validity of process and the truth of its outcomes. But merely claiming that “Science is the opposite of BS” will not convince the skeptics or convert the fanatics.
Explaining the nature of science is made difficult by misleading portrayals of science. For instance, a naive view of science defines it as the discovery of facts or phenomena. But is it science when someone discovers a new star, plant, or creature? The difficulty here is that a discovery needs to meet many additional criteria to be considered to be a “scientific” one. For instance, a claim is evaluated against a background of existing knowledge and checked by commonly accepted methods. Thus, what counts as “science” is already shaped by the scientific context. On the surface, the dependence of science on existing beliefs and assumptions can seem as circular as the pseudo-scientific vice of only accepting facts that fit to our opinions.
A good starting point for distinguishing science from pseudo-science is that merely raising questions and sowing doubt is cheap. Similarly, providing some “explanation” for a phenomenon is super-cheap as long as it cannot be tested (e.g., “Why did X happen? Because of Y.”). By contrast, actually discovering new facts, uncovering causal mechanisms, and linking them into theories is difficult and challenging. The key advantage of true statements over false ones is not their truth value, but the fact that true statements can be connected to other insights and used to make successful predictions.9
An honest quest for predictive success is what visibly sets science apart from pseudo-science: Science may argue a lot, but still cares less about winning arguments than about what actually works when making predictions. Ultimately, merely finding some “study” that refutes an opposing position does not allow us to make better predictions or design useful tools. For instance, the merit of some new medication does not depend on its creator, its ideological background, or its match to my personal preferences. Instead, the substance either works or does not work for treating the ailment for which it has been designed. And, crucially, merely assessing whether something works is a relatively simple feat that does even require an understanding of the underlying mechanism. The possibility to determine if something works without knowing how it works unmasks the cheap references of pseudo-scientific charlatans to “the limits of scientific insight” and forms the core of scientific evaluations. In practice, assessing effects may involve technical instruments and statistical methods, but the underlying causal models are well understood and allow for drawing simple conclusions.
Given many signs of scientific progress, it is sad and ironic that people occasionally perceive disputes and struggles among scientists as a weakness. Instead, it actually is a sign of strength when scientific results are met with skepticism, intensely scrutinized, and often proven wrong. By contrast, biasing one’s methods to fabricate “suitable evidence” mocks the scientific process. Not only is confirmatory evidence quite boring, but it is also wasteful and — as it can only support pre-determined conclusions — utterly futile. Hence, whereas science is always at risk of being refuted by new evidence, pseudo-science can simply refute any dissenting evidence.
Another common misunderstanding of science is that it merely provides “theories” whereas we actually care about “facts”. Suggesting such a contrast is ignorant and misleading, as facts do not even exist independently of theories. On the one side, what we consider to be a “fact” crucially depends on our assumptions, categories, and motivations. On the other side, a “theory” is not some random collection of vague hypotheses, but a systematic way of collecting, linking, and thinking about the available facts. As a data-based analogy, we can view a theory as deciding that a variable matters and should be measured. The values of the variable then provide the corresponding facts. Clearly, claiming to care about the values, but not the variable, makes no sense.10 So the gap between theories and facts is mostly a rhetorical device designed to discredit science. In reality, the practice of science is not a fixed edifice of facts or theories, but primarily a method and a mindset.
We cannot possibly list all scientific methods here. However, relying on the empirical evidence of representative samples (i.e., “good data”) and studying the relations between causal variables (“hypothesis-driven experimentation”) gets us quite far in the right direction. Of course, any useful scientific method can also be abused. But reports of bad scientific practices (like the data fabrication, \(p\)-hacking, or distortions based on incentive structures, like publication bias) should not be mistaken as the norm. Thus, selectively engaging in research to promote particular viewpoints is an abuse of scientific principles. Similarly, selectively citing only one-sided evidence may be common in economic and political contexts, but should not be mistaken as making scientific arguments.
A scientific mindset is not necessarily characterized by an abundance of knowledge or the ability to cite scientific studies. Instead, its hallmark is a general openness for evidence, paired with a curiosity for data that might confirm or refute one’s current assumptions and beliefs. As science is built upon numerous assumptions, entails many adopted beliefs and is embedded and constrained by many historic, economic and social contexts, it would be naive to portray scientists as completely “open”, “neutral”, or “objective”. Nevertheless, scientists still aim to adopt an open and objective viewpoint and no honest and self-respecting scientist would fake data or results just to support a particular viewpoint. As a result, science can be laborious, but also very persuasive. But this is precisely because science is not designed to be an instrument for the persuasion of others, but rather provides the means and methods for finding things out.
We argued above that pseudo-science and conspiracy theories are characterized by a biased skepticism that primarily aims for confirmation. Whereas evidence is invaluable for the progress of science, biased and selective evidence is misleading and worthless. A second flaw of non-scientific approaches is that they lack external and sound criteria for accepting theories, facts, and findings. If anything that supports my views is accepted as a fact, changing my views would also change the facts. As this is obviously absurd (except for very egocentric personalities), science rests on the assumption of a reality and truth that can be approximated, described and discovered.
When portraying science as a particular mindset or a collection of established methods, we must be careful not to idealize it. For instance, historians and philosophers of science have pointed out that scientists always make assumptions and rarely aim to falsify their hypotheses or theories. Instead of drawing a straight line from dark ignorance towards enlightenment, science often proceeds on bumpy and twisted paths. A key condition for scientific consensus are the interactions among scientists and their cultural and social contexts. However, the fact that reality is more complicated than a textbook introduction does not warrant a premature dismissal of science (see Oreskes, 2019, for a discussion of these issues).
Practice
Scientific characteristics
Discuss and provide examples for the following characteristics of science:
Use of models and theories: Describing phenomena by constructs and developing hypotheses about relationships between constructs. Need for criteria for determining the truth / agreeing on assumptions and findings.
Respect for evidence and method: Honest investments into finding out facts vs. developing new measures and methodologies.
-
Many social elements: A community of practitioners strives for consensus by not only agreeing on facts, but also on criteria and methods.
- Agreeing on sensible units and the value of constants (e.g., \(\pi\))
- Agreeing on accepted methods: internal vs. external validity
- Agreeing on criteria for evaluating results (e.g., statistical methods) and accepting conclusions
- Aiming to manage uncertainty (rather than pretending to provide certainty): Contrary to the expectations of politicians and critics, science does not discover eternal truths and certainties. Instead, it allows for multiple views (as long as they do not contradict current evidence) and changes its mind when the evidence changes.
Dichotomies
Discuss the following conceptual dichotomies and statements in the context of scientific research:
Specialization vs. abstraction (or digging deeper vs. aiming for generalization): “Science is both deep and wide.”
Fitting vs. predicting data: “Explanation is cheap, but prediction is what really counts.”
1.2.3 Data science
Having discussed some facets of data and science, we can return to our initial question: What is data science (or DS)?
The term “data science” was coined by D.J. Patil in 2008 (Davenport & Patil, 2012). By 2013, a corresponding job description was popular enough that university programs began to satisfy the demand (Miller, 2013). A decade later, most higher education institutions offer some corresponding curriculum and degree (see De Veaux et al., 2017).
Despite the new name, DS is not a new phenomenon. In academia and science, experts from various disciplines have quickly pointed out that data science is mostly a mix of computer science and statistics. As a consequence, many skeptics view the rise of the new discpline with a mix of amusement and envy (Donoho, 2017).
But even those who attribute all the hype to an exercise in repackaging ‘new wine in old bottles’ are facing a conundrum: When computers, data, and mathematics are usually considered to be dry and dull, how can working as a “data scientist” be touted as the “sexiest job of the 21st century” (Davenport & Patil, 2012)? What is the secret superpower that suddenly endows a nerdy topic with sex appeal?
The reason for the difference in evaluation lies in a reappraisal of data. As a side-effect of the universal use of computers and the world-wide web, our daily activities leave a trail of data. And while statistics has historically been viewed as an administrative discipline for better government (Hacking, 1990), corporations increasingly realized that data can be used in profitable ways.
The exact meaning of DS differs depending on whom you ask. As all academic disciplines deal with data in some form, trying to locate it in university departments is an entertaining but ultimately fruitless exercise. When exploring the nature of science above, we have seen that scientific disciplines are best characterized by their mindset and methodology, rather than their focus on particular content domains. Hence, a promising way to characterize data science could portray it as a methodological discipline: A field that develops and improves reliable and valid methods for collecting, processing, and deriving conclusions from data. Instead of aiming for a fail-proof definition, we will briefly address two related questions:
How does DS relate to other areas and disciplines?
Which knowledge and skills should an aspiring data scientist have?
Related areas
When mentioning a course or curriculum on data science, some questions immediately coming up include:
- Why is this not some form of computer science?
- What is the relation between data science and statistics?
- What has this to do with social science X (economics, psychology, sociology, etc.)?
Again, different people will provide different answers to these questions. The confusion is justified, as DS is not a single and homogeneous discipline. Instead, it overlaps and is intricately interwoven with several other academic fields and requires corresponding skills. For instance, becoming an expert in DS requires considerable knowledge in statistics, but the discipline of data science is not as mathematical as statistics. Similarly, data science involves computers, but is usually not as much concerned with abstract formalisms as computer science. We could describe DS as applied statistics or applied computer science, but this would suggest that it is a sub-discipline of these other fields — and any serious application ususally assumes knowledge of the discipline’s foundations.
An alternative to defining DS as an academic discipline (and its relation to other disciplines) is to view DS as an area of expertise that involves a combination of tasks and corresponding skills. Figure 1.5 illustrates that data science requires aspects of statistics, visualization, and modeling. But rather than being a part of any of these fields or involving all of them, the knowledge and skills of DS partially overlap with those areas.

Figure 1.5: Data science combines a variety of areas and skills. (The central position of R in this diagram could be complemented or replaced by other DS languages.)
Figure 1.5 also visualizes the relation of DS to R (or any other DS language). As R is defined as a “software environment for statistical computing and graphics” (R Core Team, 2025b), it supports and provides tools for all topics mentioned and is thus pictured at the center. However, this central position does not imply that R is the only or a necessary tool for DS (e.g., a popular alternative is the programming language Python). Also, the support of specific tasks (e.g., some particular type of visualization or model) is usually delegated to R packages, which are hosted at The Comprehensive R Archive Network (CRAN). But the fact that R caters to all areas of DS is good for us, as growing our R skills will enable us to prosper in multiple directions.
1.2.3.1 Required skills
Figure 1.5 also provides a partial answer to our second question:
- Which knowledge and skills should an aspiring data scientist have?
As DS is not a well-defined discipline, not all data scientists share the same set of skills. And although not every individual needs to be an expert in all areas, it certainly helps to have a basic understanding of most of them. Two specific questions that are raised regularly concern the requirements regarding skills in statistics and computer programming.
To judge the quality and suitability of data, data scientists usually need a basic understanding of statistics (e.g., notions of sampling, statistical inference, and probability distributions). But although many analyses may use quite complex statistical models, most real-world data scientists do not need a degree in statistics. Instead, having mastered a basic and an advanced course in statistics at university level (e.g., understanding the general linear model and some variants of regression) may be sufficient to work in DS. By contrast, actually contributing to the frontiers of DS as an academic discipline will require additional specializations (e.g., knowledge of signal detection theory or Bayesian modeling). But as those skills are often taught in engineering disciplines and natural or social sciences, they do not necessarily require mathematical degrees. And people conducting research in machine learning are usually so specialized that they do not fit into one of the existing academic categories, but rather define their own field.
As for the need of programming, we can quote fortune(52) of the fortunes package:
Can one be a good data analyst without being a half-good programmer?
The short answer to that is, ‘No.’
The long answer to that is, ‘No.’Frank Harrell (1999), S-PLUS User Conference, New Orleans
A caveat on this quote is that Frank Harrell is an eminent expert in both medical statistics and R (and its precursor S). It is to be expected that exceptional expertise in a field implies detecting lots of nuances and dependencies. But interestingly, the quote only states that good data analysts should have some programming skill. However, it does not define what counts as a “half-good programmer”, nor does it insist on expert programmers. While we agree that good data science requires some programming, we trust that the necessary core of knowledge and skills is pretty basic and can be easily acquired by university students of any specialty.
Although it usually helps to have technical skills (e.g., managing data bases or creating visualizations), a lack in some particular skill can often be compensated by skills in other areas. This is fortunate, as many people successfully working in DS did not start out as programmers, but acquired programming skills while studying other fields. Being a skilled DS expert usually requires a conceptual understanding and proficiency in at least one computer language (dealing with different types of data and writing corresponding functions) and some algorithms (e.g., for loading, analyzing and drawing conclusions from data). However, rather than requiring advanced computer science courses, DS typically assumes a solid grasp of a diverse range of skills and technological tools.
As successful DS also implies asking good questions, locating suitable data, and communicating one’s results, being an expert programmer does not yet make a successful data scientist. As we will see in Chapter 15 on Exploring data, the statistician John Tukey argued that data analysts need the skills of a detective (Tukey, 1969). A similar case could be made for investigative skills of journalists, like the ability to locate valuable data, express numeric facts as narratives, and tell an informative and captivating story.
Overall, the skills for successfully dealing with data are not confined to one discipline or talent. As data scientists must discover, mine, select, organize, transform, analyze, understand, communicate and present information, they tend to be generalists, rather than specialists. Beyond a set of skills from a diverse range of areas, getting DS done requires the familiarity with and mastery of suitable tools.
1.2.4 Tools
I suppose it is tempting, if the only tool you have is a hammer,
to treat everything as if it were a nail.Abraham H. Maslow (1966, p. 15f.)
Which tools should we use to process and analyze data? An anecdote from the COVID-19 pandemic illustrates the troubles of importing data: Importing data is an early and usually mundane step in the process of data analysis. Under ideal circumstances, reading data would be so seamless that it would remain unnoticed.
The fact that DS textbooks include chapters on Importing data reminds us that our world is not ideal: Depending on their sources and types, messy datasets can be difficult to read. This is unfortunate, as it often prevents people from using R and drives them to use less powerful software, which may seem easier or more convenient to use.
A striking example of bad software choices is the Public Health England (PHE)’s recent decision to import CSV-files on COVID-19 test results into Microsoft Excel’s XLS file format. Due to this file format’s artificial limit to a maximum of 65.536 rows of data, nearly 16.000 Covid cases went unreported in the U.K. (which amounts to almost 24% of the cases recorded in the time span from Sep 25 to Oct. 2, 2020). Two noteworthy quotes from this BBC article (Kelion, 2020) are:
… even a high-school computing student would know that better alternatives exist.
and
… insiders acknowledge that the current clunky system needs to be replaced by something more advanced that excludes Excel, as soon as possible.
So why are we often using unsuitable tools? And why is it difficult to design or adopt better tools?
Flexibility
When designing a tool, a possible goal could be to make it as versatile or flexible as possible. One way of increasing flexibility is combining a variety of tools in a toolbox.
A typical Swiss Army knife (as shown in Figure 1.6) provides a good example for a toolbox that provides a range of mechanical tools (blades, screwdrivers, tweezers, etc.) to tackle common tasks (cutting, opening, tweaking, etc.).
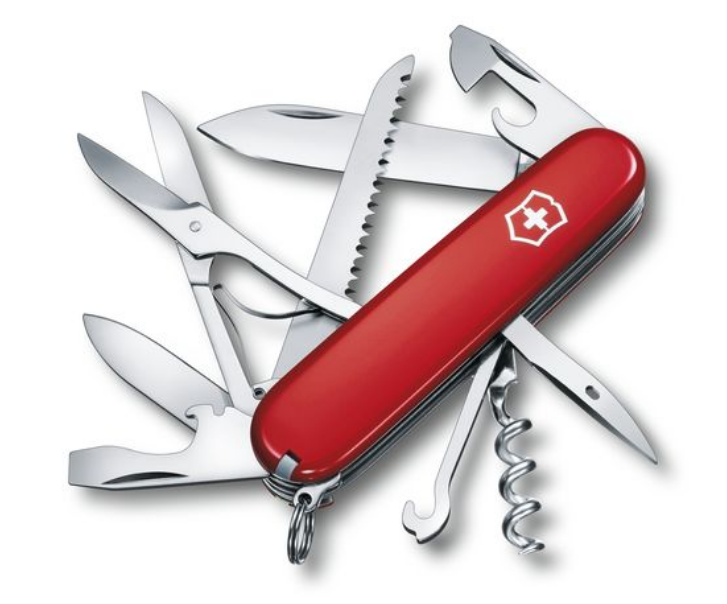
Figure 1.6: A Swiss army knife is a useful toolbox, given corresponding tasks (image from victorinox.com).
By analogy, R can be characterized as a toolbox of software tools for addressing a wide array of tasks (data acquisition, manipulation, analysis, etc.).
Specialization
Interestingly, a toolbox achieves flexibility by combining many highly specialized tools. Applying the toolbox analogy to R seems straightforward: R can — given that it consists out of many more specialized packages — be thought of as a toolbox.
But simple analogies can quickly get confusing if we consider them in greater detail. As individual R functions, R packages, any R installation, and the RStudio IDE all are “tools” on some level, R actually is part of an elaborate toolbox ecosystem. For instance, RStudio could be viewed as a toolbox that provides access to the R toolbox, which contains many smaller boxes and tools for tackling statistical tasks. Similarly, an R package that creates visualizations is a toolbox with functions that are tools for solving visualization problems. Depending on our perspective, we do not necessarily see a single hierarchy of systems, like an elaborate chain of Matryoshka dolls. Instead, R provides us with a wide array of functional tools that can be flexibly combined, embedded, and re-arranged into toolboxes and together provide a wild medley of boxes, clusters, and ecosystems.
Whenever choosing or designing tools, two opposing goals must be balanced. One is a tendency of covering a wide range of functions, whereas the other is the virtue of simplicity.
Feature creep
A potential problem when designing tools is the curse of featuritis or feature creep (see Wikipedia): Many technological gadgets — and especially software tools — contain too many functions. As a consequence, the devices or programs get bloated and over-complicated, rather than functional and simple.
Given the ubiquity of computers (especially as phones, tablets, but also watches or cars), we are getting used to universal machines. However, does a coffee machine also need a timer, WiFi connection, or offer us 23 varieties of coffee? Do we really need a text editor that also handles email, browses files, and performs spreadsheet calculations?
Again, the Swiss knife analogy is helpful: We can add more and more features, but at some point, the knife gets clumsy. For instance, the XAVT Swiss Army Swisschamp Xavt Pocket Knife, Multi is as wide as long, weighs 350 grams, costs over EUR 300, and contains 83 functions (a watch, various wrenches, a fish scaler). Its advertisement states that “versatility knows no limits” and it is “fit for all tasks”. However, I suspect it mainly serves as an expensive collector’s item that is rarely used for anything.
Simplicity
Make everything as simple as possible,
but not simpler.Albert Einstein
Perhaps the opposite of feature creep is the goal to create simple tools. The so-called KISS principle captures this in the motto “Keep It Simple, Stupid” or “keep it short and simple”, KISS urges designers to avoid excessive complexity and keep things as simple and straightforward as possible.11
Many systems work best when they are reduced to their essential parts and functions. But Einstein’s quote hints at the difficulties of aiming for simplicity: What exactly is “as simple as possible”, rather than too simple?
The tension between a tool’s flexibility and specialization is inevitable and will always have to be negotiated. Similarly, simplicity is always relative to other aspects of the task at hand. Hence, striking the right balance between flexibility and simplicity is difficult. Especially when tasks and tools are dynamically evolving, equipping an ideal toolbox gets very challenging. The following section aims to formulate a general solution that gravitates around the notion of ecological rationality.
1.2.5 Ecological rationality
When is a tool a good one? A simple answer is: A good tool must fit to our task. When fleshing out the details, however, we quickly see that this notion of fitness is a relative matter: Essentially, what exactly constitutes the current task depends on both the user (e.g., her capacities and skills) and the environment (e.g., the presence of other resources and constraints). Thus, evaluating some tool’s quality or usefulness urges us to adopt a systemic view, in which tasks do not occur in isolation, but are embedded in environments in which agents with particular capacities and skills pursue their goals.12
Fitness as correspondence
The important insight that a tool’s fitness or suitability depends on the correspondence between agent, task, and environment is captured in the notion of ecological rationality (ER, e.g., Todd et al., 2012).
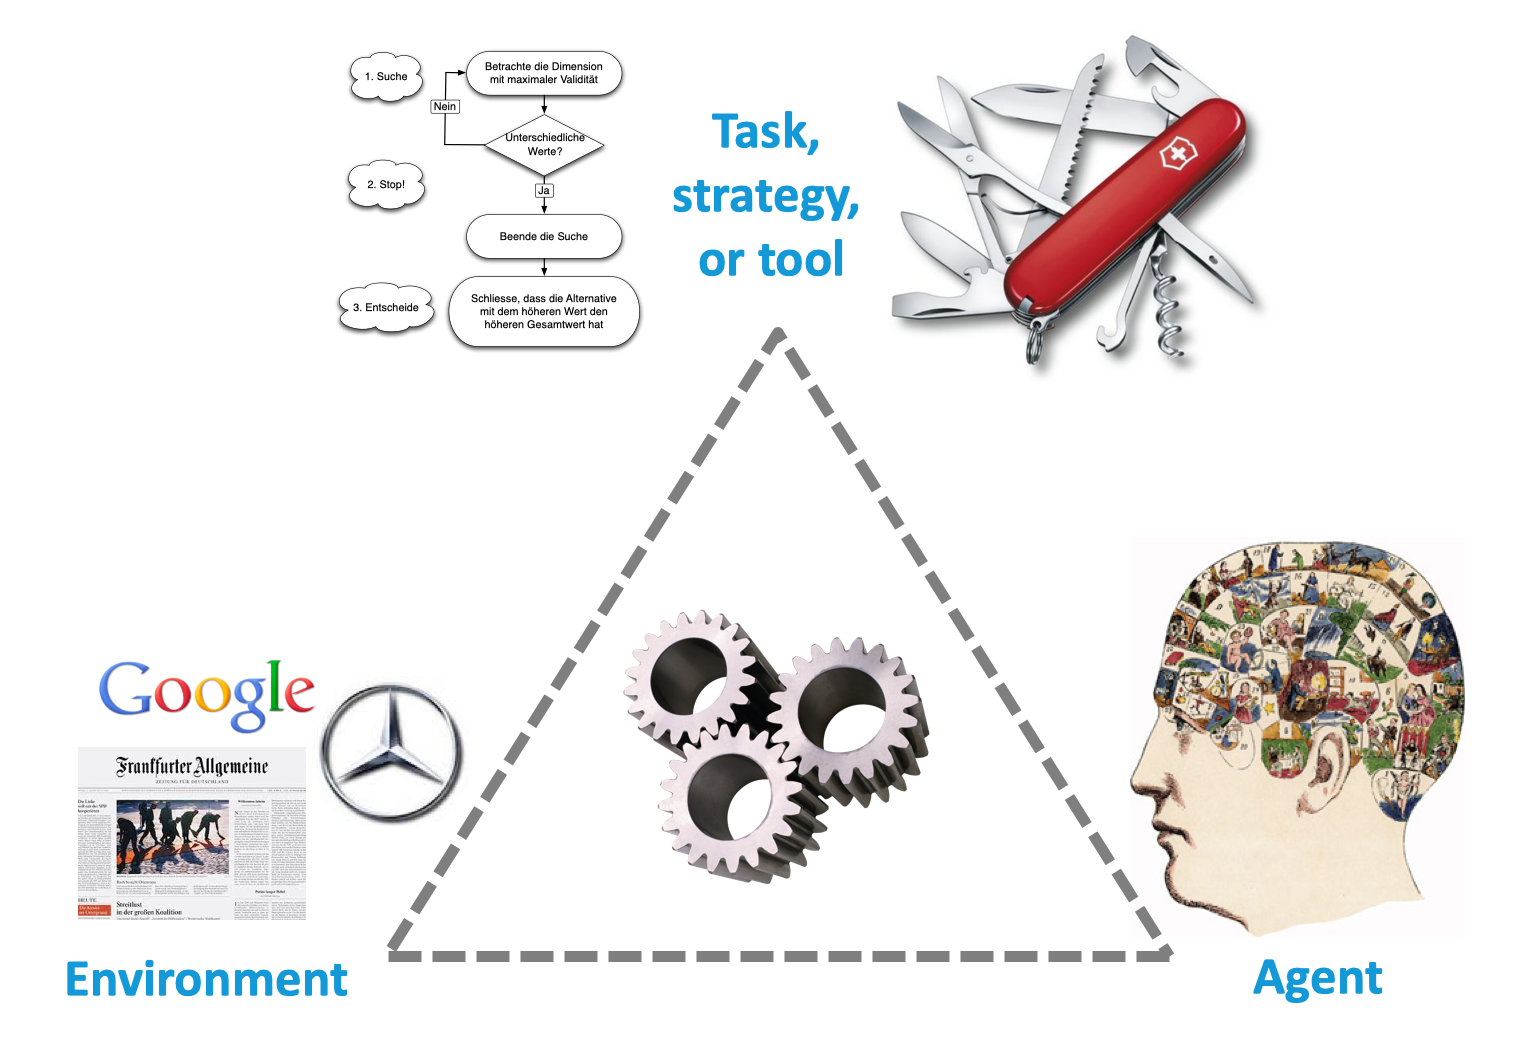
Figure 1.7: The notion of ecological rationality (Todd et al., 2012) examines the degree of correspondence between (a) a task, strategy, or tool, (b) the environment, and (c) the agent’s capacities and skills. In case of a match, the task becomes intuitive and the tool becomes transparent.
Figure 1.7 illustrates that ER examines the correspondence between three entities:
the task, strategy, or tool (e.g., some algorithm, physical toolbox, or software package);
the environment (e.g., physical environment, but also historical, social, institutional, or technological environments); and
the agent’s capacities and skills (e.g., cognitive and perceptual processes, but also knowledge and learned skills).
A method or tool is ecologically rational if it enables a match between an agent’s task and the task environment.13 In case of ER, the tool will appear well-designed — its use becomes intuitive — and ideally disappear from view (i.e., become transparent and remain unnoticed). By contrast, if the agent has to devote attention or effort on the tool, the task will suffer and appear more difficult. In psychological terms, a problem’s ease or difficulty hinges on the correspondence between the problem’s representation and its solution. Herbert A. Simon expressed this aptly as follows:
Solving a problem simply means representing it so as to make the solution transparent.
(Simon, 1981, p. 153)
Designing for fit
Working out what exactly renders tools or problems transparent is an ongoing challenge in many scientific fields. Note that conceptualizing ER as a matter of correspondence would be circular, if there were not two distinct levers that allow us to adjust the degree of correspondence and enable a better fit:
Lever 1 is the agent, whose capacities and skills can be increased (by removing distractions, educational measures, or by adding experience).
Lever 2 is the environment, which can facilitate a task by easing constraints or designing better tools.
Thus, ER is not just an explanatory framework in psychology, but also a principle of instruction (e.g., for creating better trainings and tutorials) and a guideline for design (e.g., creating better representations and more intuitive tools).
Next, we will encounter a technological tool that is designed to integrate text and code to render the process of scientific research more transparent. But to motivate the use of R Markdown, we first need to understand the appeal of reproducible research.
1.3 Reproducible research
A key goal of scientists is to publish their findings (e.g., to gain degrees and promotions, recognition, and research funding). But most scientific publications are rarely read and hardly cited. This is unfortunate and partly owed to the increased specialization of fields and journals, and the fact that scientists are more motivated to write their own articles than to devote time to reading those of their peers. But even when making an effort to study the results of others, the lack of detail in many articles is frustrating. The reason for deploring this lack is that science should be repeatable.
1.3.1 Terminology
To improve the transparency of scientific findings, Peng & Hicks (2020) make the following distinction:
replicability is the ability to repeat scientific claims and results in independent investigations.
reproducibility is the ability of independent analysts to re-create the results claimed by the original authors using the original data and analysis techniques.
Although replicable and reproducible are often confused, they are different concepts. Both terms imply some aspect of stability, repeatability, and reliability, but with respect to different objects and parts of the scientific process:
The notion of replicability refers to a scientific investigation (i.e., the process of scientific discovery, e.g., by conducting a study or survey): Being replicable implies that different research efforts that repeat the same steps with the same setup will yield identical patterns of data. If findings are replicable, a hypothesis or result is gaining credibility and can be generalized in scientific theories.
The notion of reproducibility describes how data is being handled (i.e., the process of data analysis, e.g., by transforming data and using statistics): Being reproducible implies that all analysis steps of some data can be repeated to yield the same patterns of results. Reproducible findings help us to explain and understand the process of analysis and gain trust that the results are not based on errors or personal preferences.
Note that there are other — and typically more demanding — definitions of reproducible research Rougier et al. (2017). Our distinction is primarily based on Peng (2011), who states that “Reproducibility has the potential to serve as a minimum standard for judging scientific claims when full independent replication of a study is not possible.” (p. 1226).
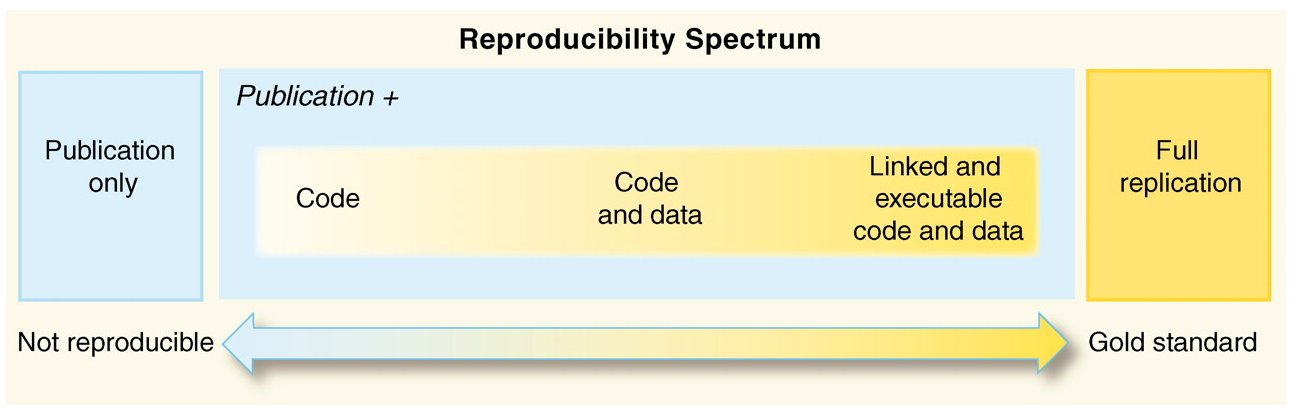
Figure 1.8: The spectrum of reproducibility (Source: Fig. 1 from Peng, 2011).
Figure 1.8 (taken from Peng, 2011) illustrates that we can think of reproducibility as a continuum. On one end, there is the traditional publication. For instance, a typical article in a scientific journal describes how data was acquired, how it was processed and analyzed, and which results were obtained. These results are then interpreted, discussed, and possible conclusions drawn. Interestingly, courses of scientific writing typically emphasize that a goal of writing both Methods and Results sections is to be as detailed and explicit as possible. Nevertheless, it usually remains difficult or impossible to replicate a study based on its publication alone.
An alternative extreme is provided as the “gold standard” at the other end of the continuum. Enabling a complete replication would require much more detail than any description of methods or results in journal article provides. For instance, it would require a full account of all equipment and materials used to acquire the original data. Also, many experimental designs allow for a large variety of statistical tests. If this flexibility remains undisclosed (e.g., if the original study design, data, or analysis protocols are not published), researchers have immense freedom to fish for all kinds of statistical effects (see Simmons et al., 2011, for a demonstration).
Overall, scientific investigations should be both replicable and reproducible. Although the concepts refer to either the process of scientific discovery or the analysis of data, both increase the trustworthiness of scientific findings.
1.3.2 Towards more reproducible research
Our discussion so far has focused on the why of reproducible research, rather than its how. Whereas the general goals of reproducible research are easily endorsed, it remains a matter of discussion exactly what is required to act in accordance with this ideal. Rather than providing a comprehensive list, we will point out the general principle and provide an example, before suggesting a tool for conducting reproducible research.
Transparency
The general principle of reproducible research is a commitment to transparency. Enabling others to check our research requires that they can not only see our final results and interpretations, but also a record of the processing steps that led from our original data to these conclusions. In short, we need to document not only what was done to acquire data, but also the data and how we analyzed it to derive our conclusions. As both data and our data analysis are typically stored in one or more electronic files, this essentially implies that we provide these files with sufficient documentation in some accessible format.14 While asking for the disclosure of the analysis process still leaves a lot of room for creativity, personal preferences, and error, it provides a necessary condition for enabling others to understand what was done.
Reproducible randomness
A good example for reproducible research is provided by reproducible randomness.
When randomly drawing elements from some population (e.g., in some statistical procedure known as “bootstrapping”), different draws will typically yield different results.
This implies that any instruction or script that includes a random process is bound to entail different paths, unless the original creator of the random process takes some precaution that others can obtain the same results.
Although true randomness is a substantial challenge for computers, most software systems provide some means of simulating randomness.
In R, the sample() function allows to sample elements from a given set x.
For instance, the following expression draws three elements from the integers from 1 to 10:
# Draw a set s of 3 random numbers (from 1 to 10):
sample(x = 1:10, size = 3, replace = TRUE)
#> [1] 5 6 6
If we (or anyone else) were to execute the same expression again, we would — most likely — obtain different results:
sample(x = 1:10, size = 3, replace = TRUE)
#> [1] 8 1 1
sample(x = 1:10, size = 3, replace = TRUE)
#> [1] 9 2 1
Thus, any data analysis that contains this statement and subsequently uses the result of the sampling process is bound to diverge from this point onward, even if everything else (the data, software, analyst, etc.) remains identical.
A way to avoid this divergence is to explicitly initialize the state of its random generator.
In R, this can be done by evaluating the set.seed() function with a specific value prior to the random sampling step:
set.seed(seed = 100)  # for reproducible randomness

# Draw a set s of 3 random numbers (from 1 to 10):
(s <- sample(x = 1:10, size = 3, replace = TRUE))
#> [1] 10  7  6
mean(s)
#> [1] 7.666667
Using set.seed() with a seed value of 100 was arbitrary (as we could have used any arbitrary value), but ensures that the three values drawn by sample() (and stored in s) will always be 10, 7, 6. In this example, the lowest number in s turns out to be 6, which implies that the value of mean(s) is rather high (given that we would expect it to approach a value of \(\frac{1 + 10}{2} = 5.5\), if we had obtained large sample of independent draws).
By including the set.seed() expression in our code, we essentially were sacrificing true randomness for the sake of transparency.
The example also illustrates that computer code is typically more precise than verbal descriptions.
Whereas the phrase “Randomly draw three numbers from 1 to 10” fails to specify whether we could draw the same number repeatedly, the replace = TRUE argument of the sample() command explicates that the authors were thinking about drawing with replacement (even though our actual set s did not include a repeated element of x).
The key point here is not just to always use set.seed() to render randomness reproducible, but to anticipate the effects of all our decisions when analyzing data.
When aiming for reproducible research, we need to distance ourselves from our own idiosyncrasies and adopt the perspective of an external reviewer who works through and tries to understand the steps of our analysis.
Thus, reproducible randomness is mostly a mind-set:
A willingness for viewing one’s work through the eyes of observers and a commitment to transparency.
1.3.3 R and R Markdown as tools for transparency
The primary tool endorsed for reproducible research in this book is R. Being a free, open-source, and popular language for statistical computing makes R a great candidate tool for reproducible research involving the analysis of data.
More particular tools that greatly facilitates a transparent process of data analysis is the technology of R Markdown and the corresponding rmarkdown package (Allaire et al., 2025), both developed and maintained by the Posit team (formerly RStudio). Advertised as a tool for creating dynamic documents, R Markdown essentially allows to combine text and code into a variety of document types (in combination with other tools, e.g., the knitr package and a range of conversion scripts for different file formats). Rather than providing a long introduction into R Markdown, we will explain its general principle and then link to instructional resources that provide a hands-on experience with this tool.
A tool for literate programming
The general principle of R Markdown is to be as unobtrusive as possible — or, ideally, to become transparent. For illustrative purposes, consider the process of reading. When reading an important message — e.g., one that provides the solution to a vital problem — it does not matter whether it is written on a piece of paper, displayed on a screen, or chiseled in stone. Thus, when focusing on the message, its medium is secondary and usually ignored. By contrast, writing the message in different media requires very different processes.
When creating content for an audience, our goals and tasks typically gravitate around some topic, rather than the technology that we are using to write and transmit our content.15 Ideally, the technology and tools used in a creative process should disappear, so that we can devote all of our limited attention on the intended message. But fully focusing on content is difficult when the process is cumbersome (e.g., chiseling in stone) or the tools are complicated (e.g., using an unfamiliar software system). The difficulty of using unfamiliar tools mirrors our difficulty of using unfamiliar mental representations (e.g., using a foreign language or solving arithmetic problems in a non-standard notation). The key catalysts for both achieving greater proficiency in thinking and in using technology are the same: We need suitable tools and lots of experience in using them. As the tools used in our environments are typically provided to us (by social contexts like education and culture), our main levers for acquiring proficiency and skills are the selection of tools and practice in using them.
The power of R Markdown (and other typesetting systems) is primarily based by separating source files from output documents. The distinction between input and output is based on the paradigm of literate programming [Knuth (1984), as mentioned here). Although the proliferation of files may seem like a nuisance at first, it enables the separation of content and form and ensures that the same content can be used and recycled in a variety of forms.
Good tools — like R or R Markdown — may generally appear “complicated” at first, but this impression is mostly a reflection of ourselves (our current level of knowledge and skills). If tools are well-suited (or fit) for the task and well-designed to be used by people with our basic capacities and skills, gaining more experience will ideally allow us to solve our tasks an intuitive fashion. Eventually, we may succeed in ignoring the tool and fully focusing on content. When experiencing this treasured state of creative flow, the system of our current goals or tasks, our tools, and our skills have reached a state of ecological rationality.
Instructions and resources
Learning R Markdown requires a suitable infrastructure (e.g., the software environment described in the Preparations section of our Welcome page) and a tutorial that introduces its basic commands and workflow. As the online resources at https://rmarkdown.rstudio.com are very helpful, there is no need to repeat them here.
A good idea for learning is to create a new .Rmd document and then work through the sections of the
R Markdown Cheatsheet (especially the section “Write with Markdown”).
Ideally, you should do this now — and try to repeatedly knit an .Rmd input file into an .HTML output file.
For additional instructions on combining text and code, see
Chapter 27: R Markdown of the r4ds textbook (Wickham & Grolemund, 2017).
Appendix F: Using R Markdown of the ds4psy textbook (Neth, 2025a).
One of the most valuable features of R Markdown is that it can generate a wide range of output document types (e.g., blogs, books, handouts, slides, and websites) and file formats (e.g., HTML and PDF) from the same source documents.16
Incidentally, the technology of R Markdown is still being developed further. A new framework called Quarto is essentially another iteration of R Markdown. See Quarto.org and Chapter 29: Quarto of Wickham, Çetinkaya-Rundel, et al. (2023) for details and an introduction.
1.3.4 Elements of reproducible research
Transparency in science implies that others should not only obtain the final results and interpretation (e.g., in the form of a published article), but also how results were derived from data. Although the following points provide no comprehensive list, here are some essential steps that will render your research more transparent:
Pre-register your research question, hypotheses, and the materials, sampling methods, and any planned statistical analyses.
Collect the data.
Conduct your data analysis, commenting all steps, and clearly distinguishing the planned from any unplanned analyses.
Provide the raw data file and all analysis scripts that process it to derive your conclusions.
Note that 3. can be a valuable documentation tool for your collaborators, and even for your future self. And 4. can happen both before or after writing a research report. If the research is not published, it can still be archived and made available.
When using freely available tools like R and R Markdown for the data analysis, Peng & Hicks (2020) mention another positive side effect: When readers can obtain the data and computer code, both of which are valuable to the extent that they can be re-used for future research. If the analysis was conducted in R, this is an excellent educational opportunity for learning R and new methods of data analysis.
Discussion
Given the availability and power of tools like R and R Markdown, it may seem puzzling and surprising that not every researcher uses them. Nowadays, the remaining obstacles to fully reproducible research are less technological than cultural: When competition weighs more than cooperation, sharing is suppressed, rather than encouraged.
While replicability and reproducibility are both desirable ideals, it is worth noting that doing reproducible research is more modest than striving for replicable research. Whereas every individual can conduct reproducible research, replicability is a great normative idea, but — like many ideals — difficult to implement in practice. For instance, if two laboratories conduct the “same” study, how similar do their participants need to be? Does it matter on which day or time the study is conducted? Are deviations due to different samples, different ways to encode data, or to different ways of analyzing the data? Essentially, reproducible research is a necessary, but non-sufficient condition for allowing us to address the broader issue of replicability.17
While our modest notion of reproducibility is much simpler than replicability and may seem straightforward to implement, it was often thwarted by a lack of availability of the data or computer software that was used in the original data analyses. Today, the availability of free software tools and online repositories implies that there are fewer such excuses left. This is a welcome trend, but far from solves all problems. For instance, ignorant or malicious researchers could still cheat on some or all steps along the way and only pretend to be transparent. Ultimately, we will always need some trust in data and the skills and tools of data analysts, but also solid checks and balances in the system (e.g., peer review, independent replications).
1.4 Conclusion
This chapter introduced R Markdown as a tool for conducting reproducible research. But as it covered a lot of conceptual ground, we will briefly summarize some important points.
1.4.1 Summary
Irrespective of their precise definitions or status, science is an active social enterprise and requires an open mindset, and data is a key building block of science. Any society that uses data productively requires some degree of data literacy among its members. From an individual perspective, gaining expertise in data science requires a variety of skills, including — but not limited to — programming and statistics. Beyond knowledge and practice, becoming data literate also requires creativity and curiosity for asking good questions.
Actually doing data analysis also requires technology and a set of suitable tools.
Tools that fit well to particular tasks tend to disappear from our attention and thus make solving those tasks simple and straightforward.
Similarly, environments that are well-suited to address our goals and needs make the corresponding tasks easy to solve.
The correspondence or match between our skills, tasks, tools, and environment indicates the presence of ecological rationality (ER). When ER is given, tasks seem easy and intuitive, but their simplicity is mostly a function of the fit.
To be valuable and reliable, scientific results should be both replicable and reproducible: Ideally, anyone repeating the same steps on the same samples should obtain the same data, and anyone analyzing this data should obtain identical patterns of results. But in order to repeat procedures and reproduce results, scientific publications must be transparent. For instance, in addition to results, the methods and procedures that led to them must be disclosed and well-documented. Thus, reproducible research is not just a nice way to explicate our analysis steps, but also a pre-condition for replicability and trust in science.
1.4.2 Resources

Pointers additional resources and useful cheatsheets include:
Data literacy and scientific transparency
There are many facets of data, science, and risk literacy. Here are a few starting points:
The data-literacy charta (2021) aims to define and promote data literacy as a key competence of the 21st century
Reproducible research provides a curated collection of recommendations (with entries on literate programming and project workflows) as a CRAN Task View
The Center for Open Science and the Open Science Foundation (OSF) provide information on and resources for more transparency in science
Markdown and R Markdown
Background on the original Markdown definition:
- CommonMark is a more strongly defined and compatible specification of the original Markdown (by John Gruber, in 2004) and provides a 60 second tutorial, plus an interactive 10 minute tutorial for learning Markdown.
Practical resources on R Markdown include (in increasing amount of detail):
A Markdown Quick Reference card is available in RStudio via
Help > Markdown Quick Reference.The R Markdown Cheatsheet, available in RStudio via
Help > Cheatsheets > R Markdown Cheat Sheet.
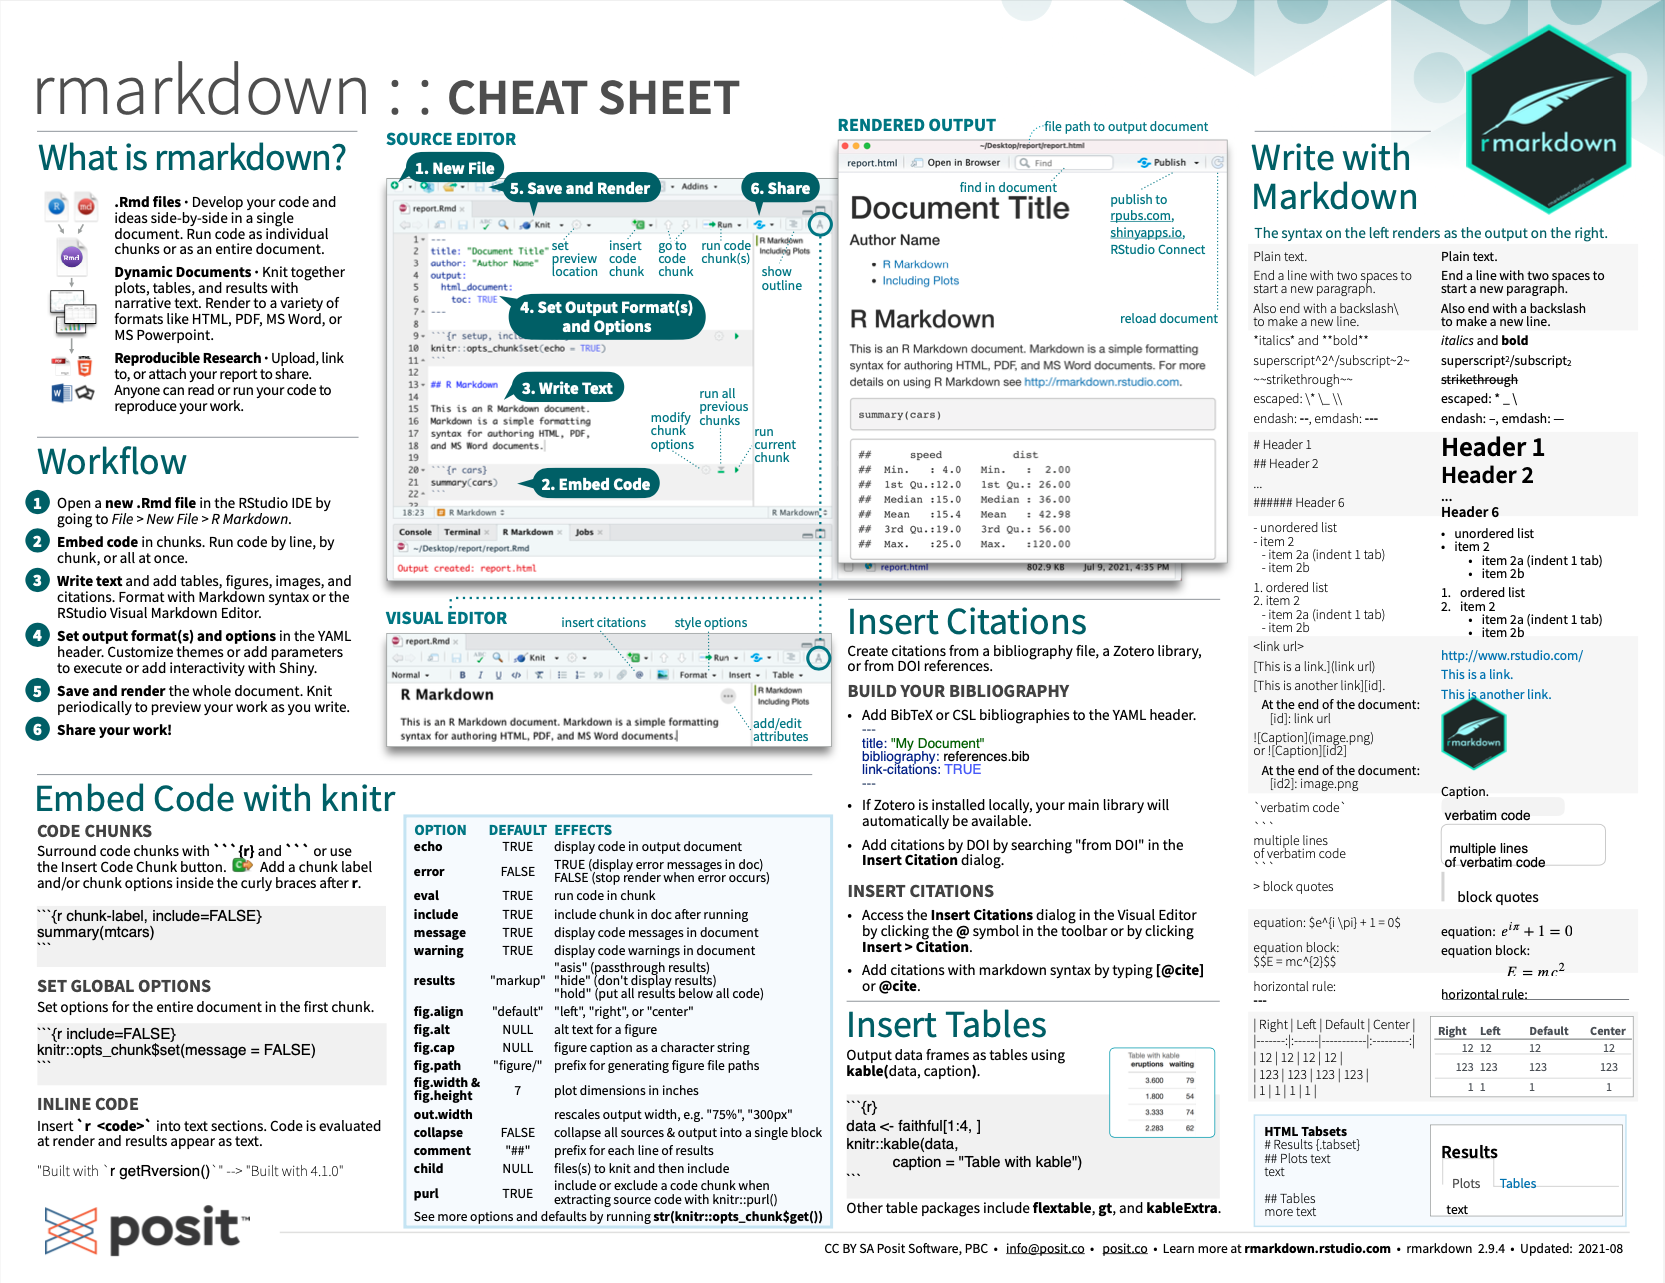
Figure 1.9: R Markdown cheat sheet (from Posit cheatsheets).
- The R Markdown documentation, available in RStudio via
Help > Cheatsheets > R Markdown Reference Guide.
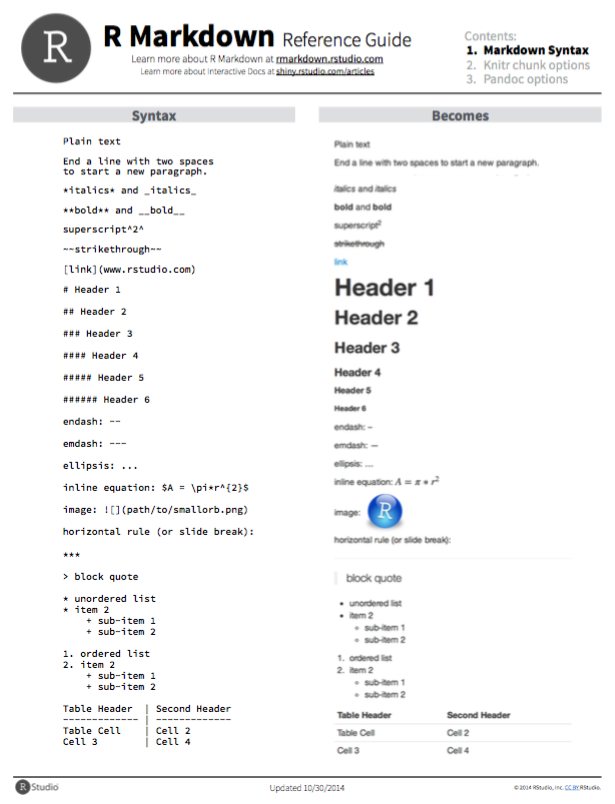
Figure 1.10: R Markdown reference guide (from Posit cheatsheets).
Helpful resources for writing scientific journal articles in R Markdown include:
Quarto
In case you prefer always using the very latest stuff:
Quarto is Posit’s next-generation of R Markdown
Quarto for Scientists is a useful ebook by Nicholas Tierney (2025)
1.4.3 Preview
With the exception of the part on R Markdown, this introductory chapter was mostly reflective and theoretical in nature. By contrast, we will now start working in R (R Core Team, 2025a). Chapter 2 will introduce the essential concepts and commands of base R.
1.5 Exercises

Every student should complete Exercise 1.5.1 and then use the same Rmd-file to document their solution to at least one of the other exercises.
1.5.1 Create an R Markdown document
Create a first R Markdown document (i.e., with the extension .Rmd):
Add a suitable header (with a title, your name, and the current date)
Save your document as
LastFirstname_i2ds_##.Rmd, withLastFirstnameactually indicating your name and##indicating the current chapter number (i.e., my current document would be calledNethHansjoerg_i2ds_01.Rmd).Regularly knit your
.Rmddocument into an.htmloutput document (and note and fix any errors that may appear).Use your document to summarize one of the key concepts of this chapter (e.g., Section 1.2) as the content of your document.
Note: At this point, your R Markdown document does not need to contain any code chunks, but it could:
- use a document header (indicating a title, author, and date);
- use headings to structure your document (with at least two different levels, and two headings per sub-level);
- add paragraphs of text (with some words in italics or bold font);
- include one or more lists (with bullet points or numbers);
- include a link (e.g., to an URL);
- include an image (e.g., our course logo, or some screenshot);
- include a table (with rows and columns);
- include a table of contents (generated automatically);
- include a list of references (with URL links to additional resources);
Feel free to discover additional nuggets in the R Markdown Cheatsheet or the R Markdown documentation, also available in the Help menu of RStudio.
Having completed Exercise 1.5.1, solve at least one of the following exercises and submit a (self-contained) version of the .html-output document as your solution (as specified in the course syllabus).
1.5.2 Aspects of a data file
In Section 1.2.1, the term data was explained by describing a file of health records. Create such a file (e.g., by inventing some patients, their characteristics, diagnoses, etc.) and answer the following questions:
What are the observations, variables, and values of your file?
In which form did you arrange the observations and variables? Can you use alternative forms to record the same information?
What type of variables (e.g., numbers vs. text) did you use? Can you think of alternative ways of expressing the same information?
Which health-related aspects of the patients could not be recorded in this file?
- Which tools (e.g., software programs) did you use to create your file? Can you think of alternative tools?
Note: R Markdown is also well-suited for formatting data tables.
1.5.3 Data vs. representations
Please answer the following questions in a few sentences (ideally in your R Markdown document from Exercise 1.5.1).
How could you record and store the data of a particular news report on TV? How would you quantify the information contained in it?
Describe the similarities of and differences between mental and external representations for an example (e.g., concepts, numbers, music).
Why do we find it more difficult to do mental arithmetic in a foreign language? How does this differ from calculating in a different number system (e.g., using the Roman numerals)?
To save a record of a conversation on a mobile phone, a person takes screenshots of all associated messages and stores them on an online server. Describe the potential benefits and costs of this transformation in terms of data formats and future uses.
-
Reflect upon a mobile phone as a tool:
- Which tasks is it designed for?
- Which other functions does it provide?
- How does its ecological rationality vary as a function of its user?
1.5.4 Representing music
Consider different ways of capturing and representing music:
- a symphony as a notation on sheets vs. a performance by an orchestra
- recording on vinyl vs. in digital (e.g., mp3) format
- reporting an audience’s experiences on a Likert rating scale (e.g., to rate enjoyment and impact)
Which phenomena are being represented or measured? Are these different representations of different things (melody vs. experience) vs. of the same thing (sound waves).
This concludes our preparatory exercises and theoretical reflections on the foundations of data science. In Chapter 2, we will get our hands dirty with code that defines and manipulates data in R.
Physical phenomena — like smoke from a fire or sound waves — can also become data when someone is interested in using and interpreting them. For convenience, we assume here that data has already been recorded in some representational form.↩︎
My favorite “theory” to explain everything is “Because of the moon”. This phrase can be used to explain absolutely everything, but predicts nothing.↩︎
The analogy of “theory/fact” to “variable/value” illustrates their interdependence, but breaks down when realizing that facts can refute theories. In this case, we could accommodate this as the power of values for changing their variables.↩︎
Origin: Aircraft engineers in the U.S. Navy in 1960s and 1970s, (see Wikipedia).↩︎
Depending on the aperture of our conceptual lens, the “environment” in focus can be described in historical, psychological, sociological, or technological terms.↩︎
In times of climate change and increasing ecological awareness, it may be worth pointing out that the “ecological” in ER emphasizes the embeddedness of and interactions between agents and their environments, rather than “biological” or “green”.↩︎
The technical infrastructure of this requirement is available in multiple locations (e.g., the Open Science Foundation (OSF).)↩︎
The obvious exception are instructions on using technological tools. However, even in those we must focus on content to reach our goal of writing the manual.↩︎
However, generating particular outputs usually requires additional software (e.g., a recent LaTeX installation, or the bookdown or pkgdown packages).↩︎
While researchers agree that replicability is a desirable ideal, the implications of this demand are a mine-field and boomerang for the entire field of psychology — and many other fields, who perhaps have not yet investigated the issue in such a self-deprecating manner. The take home message here is: Replicable research requires reproducible research, but not vice versa. Hence, we should engage in reproducible research even when replicability remains elusive.↩︎