Welcome
This book provides a gentle introduction to data science for students of any discipline with little or no background in data analysis or computer programming. Based on notions of representation and modeling, we examine some key data types and data structures, and then learn to clean, transform, summarize and visualize data to communicate our results.
The course relies on the free technologies provided by the R software environment for statistical computing and graphics (R Core Team, 2025b) and uses RMarkdown as a tool for conducting reproducible research. Whereas earlier chapters establish a foundation in base R, dedicated chapters on data wrangling and visualization cover key packages of the so-called tidyverse (Wickham et al., 2019). Importantly, our primary focus will be on the general goals and tasks of data analysis, rather than on some particular technology. Beyond introducing and using tools, we will also reflect on the principles that guided their design. Always asking why some tool is suited to tackle some task prevents us from getting stuck in fashionable niches and prepare us for a world in which many software frameworks and programming languages co-exist and continue to evolve.
New hosting service and URL (2026-01-14)
- This is an old and static version of this book, hosted at https://bookdown.org/hneth/i2ds/.
As the hosting service at https://bookdown.org is being decommissioned, more recent versions will be hosted at https://connect.posit.cloud/hneth/.
- Please visit https://hneth-i2ds.share.connect.posit.cloud/ for the most recent version!
The main limitation of this book is that it focuses on rectangular data: Data that is represented in the rows and columns of tables. What may appear to be a second limitation — the absence of sophisticated modeling and machine learning methods — may actually be a feature: Rather than chasing after the latest hypes, we emphasize the importance of basic tasks, solid skills, and simple tools.
Today, students of statistics and elementary computer science are inundated by buzzword tools and complex analysis techniques. Given the ubiquity of statistical software and machine learning platforms, even novice users are tempted to use complex methods with fancy acronyms and academic pedigrees. But when methods and tools become opaque, we cannot check the validity of our results or detect and fix potential errors. Thus, our main goals here are to promote an understanding of data-related problems, introduce basic methods for solving them, and suggest ways for communicating our findings in a transparent fashion. By reflecting on the interplay between representations, tasks, and tools, this book promotes data literacy and cultivate reproducible research practices that precede and enable any practical use of programming or statistics.
Please note
This course
What you know about computing other people will learn.
Don’t feel as if the key to successful computing is only in your hands.
What’s in your hands, I think and hope, is intelligence:
the ability to see the machine as more than when you were first led up to it,
that you can make it more.Alan J. Perlis (in the dedication of Abelson et al., 1996)
![]()
The current iterations of the course Introduction to Data Science (using R, ADILT) (abbreviated as i2ds 1 or i2ds 2) take place at the University of Konstanz in 2026. However, as all course materials are freely available online, anyone interested in this topic is welcome to read and learn from these materials.
General information on the university’s Advanced Data and Information Literacy Track (ADILT) is available at https://www.uni-konstanz.de/adilt/.
Coordinates
![]()
- Introduction to data science 1: Basics (i2ds 1, PSY-16620) and Introduction to data science 2: Applications (i2ds 2, PSY-16710) at the University of Konstanz by Hansjörg Neth (h.neth@uni.kn, SPDS, office D507).
- Course materials:
Goals
Completing this course enables students to explore, transform, and visualize data in a variety of ways. Whereas initial chapters provide a basic introduction to data types, programming, visualization, and exploratory data analysis (using base R and tidyverse packages), later chapters address more advanced issues of running simulations, predictive modeling, and creating interactive applications. Overall, the current set of chapters provides a solid introduction to data science and numerous pointers to more ambitious resources.
The course uses the technologies and tools provided by R (R Core Team, 2025b), the RStudio IDE, RMarkdown, including some key packages of the tidyverse (Wickham et al., 2019) (e.g., dplyr, ggplot2, tibble, and tidyr).
Audience and Preconditions
This course is targeted at students of all backgrounds and disciplines with a curiosity for data analysis and quantitative science. Prior familiarity with computer programming, empirical research methods or statistics is a bonus, but not a necessary condition.
Advanced students of psychology and other social sciences (e.g., working on their BSc/MSc thesis) may also consider the course and textbook Data Science for Psychologists (PSY-15150) that segments the materials in larger units than this introductory course.
Requirements
In this course, we adopt an active learning and learning by doing approach. Good preparation (by working through the current topic before each session), regular attendance and participation, and the conscientious completion of weekly exercises are essential for succeeding in this course.
Our data
Data science uses and depends on data — and this course is no exception. Although the course materials are freely available, acquiring new knowledge and skills inevitably comes with costs. The main cost of this course is that you are willing to invest effort and time to read and practice.
Additionally, we kindly ask you to provide us with a little bit of data — by participating in an online survey that takes most people about 15 minutes to complete. This survey is meant to be fun and entertaining, but also has two serious goals:
We want to collect real data that we can use to create more engaging course materials.
We want to learn more about our audience — both readers and students — so that we can better serve their needs.
If you consider these goals desirable, please take part in the following online survey to provide us with some data to work with:
The i2ds online survey
URL: Please visit https://ww3.unipark.de/uc/i2ds_survey/ to take part in the survey.
Note that the survey takes about 15 minutes to complete.
Thank you in advance for filling out this survey and allowing us to share your data!
We will handle the data with care and attempt to use it to create better educational materials.2
Preparations
Beyond data, our journey into the realms of data science also requires some technical infrastructure (tools), materials (instruction), and some sensible rules (structure). Here is a list of our basic requirements for getting started:
Software
Working through this book assumes an installation of three types of software programs:
An R engine: The R project for statistical computing (R Core Team, 2025b) is the origin of all things R. A current distribution of R — e.g., R version 4.5.1 (2025-06-13) — for your machine can be downloaded from one if its mirrors.
An R interface: The RStudio IDE (by Posit) provides an integrated development environment for R.3
Additional tools: The R packages of the tidyverse (Wickham, 2023) and ds4psy (Neth, 2025b). More specific packages that address specific tasks (e.g., providing data or color palettes) are mentioned in the corresponding chapters.
To understand the differences between these components, two analogies are helpful:
R vs. RStudio: Think of the analogy of a car — R provides the engine, whereas RStudio provides the driver’s console or dashboard (i.e., a means of providing input and output, and for monitoring current system information).
R vs. R packages: Think of the analogy of a toolbox containing a Swiss pocket knife vs. more specialized tools addressing specific tasks (see the section on Terminology).
At first, the boundaries between these tools will blur and overlap in the user’s mind. But sustaining a bit of confusion is ok, as long as it does not deter you from your goals and tasks. With more experience, you will learn to distinguish the levels of technologies more clearly and ideally get to appreciate the architectural beauty of the overall structure.
Welcome to the R world!
Once you have installed the software, take a moment to reflect on a curious fact: You just installed software that was written by hundreds of highly-trained experts, who dedicate years of their professional lives to its creation and improvement. Interestingly, you could just download their products and had to pay nothing to do so. This is possible because most R developers subscribe to an open source philosophy that was ridiculed by corporations when it started in the 1980s and 1990s, but has become one of the most powerful paradigms in software development.
But actually, you did invest time and effort to install all these programs and packages.4 And by doing so, you are taking first steps to join a world-wide community that shares certain interests, assumptions, and ideals. So, welcome to the R community — but be aware: Learning R can be addictive and profoundly transform your life!
Working with RStudio
The distinctions between R, RStudio, and R packages are somewhat confusing at first. Thus, it is good to know that we will typically be using the RStudio IDE to interact with R and manage our library of R packages. The basic idea of an integrated development environment (IDE) is to make it easier to access and manage all R-related concerns through a single interface. So think of RStudio as your console or dashboard that allows you to monitor and control the R engine underneath.
Given its large variety of functions, the RStudio interface is divided into many sub-windows that can be arranged and expanded in various ways. At this point, we only need to distinguish between the main Editor window (typically located on the top left), the Console (for entering R commands), and a few auxiliary windows that may display outputs (e.g., a Viewer for showing visualizations) and provide information on our current Environment or the Packages available on our computer. A useful window is Help: Although its main page provides mostly links to online materials, any R package contains detailed documentations on its functions and examples that illustrate their use.
Figure 0.1 shows the Posit cheatsheet on the RStudio IDE and illustrates that there are dozens of other functions available. As you get more experienced, you will discover lots of nifty features and shortcuts. Especially foldable sections and keyboard shortcuts (see Alt + Shift + K for an overview) can make your life in R a lot easier.
But don’t let the abundance of options overwhelm you — I have yet to meet a person who needs or uses all of them.
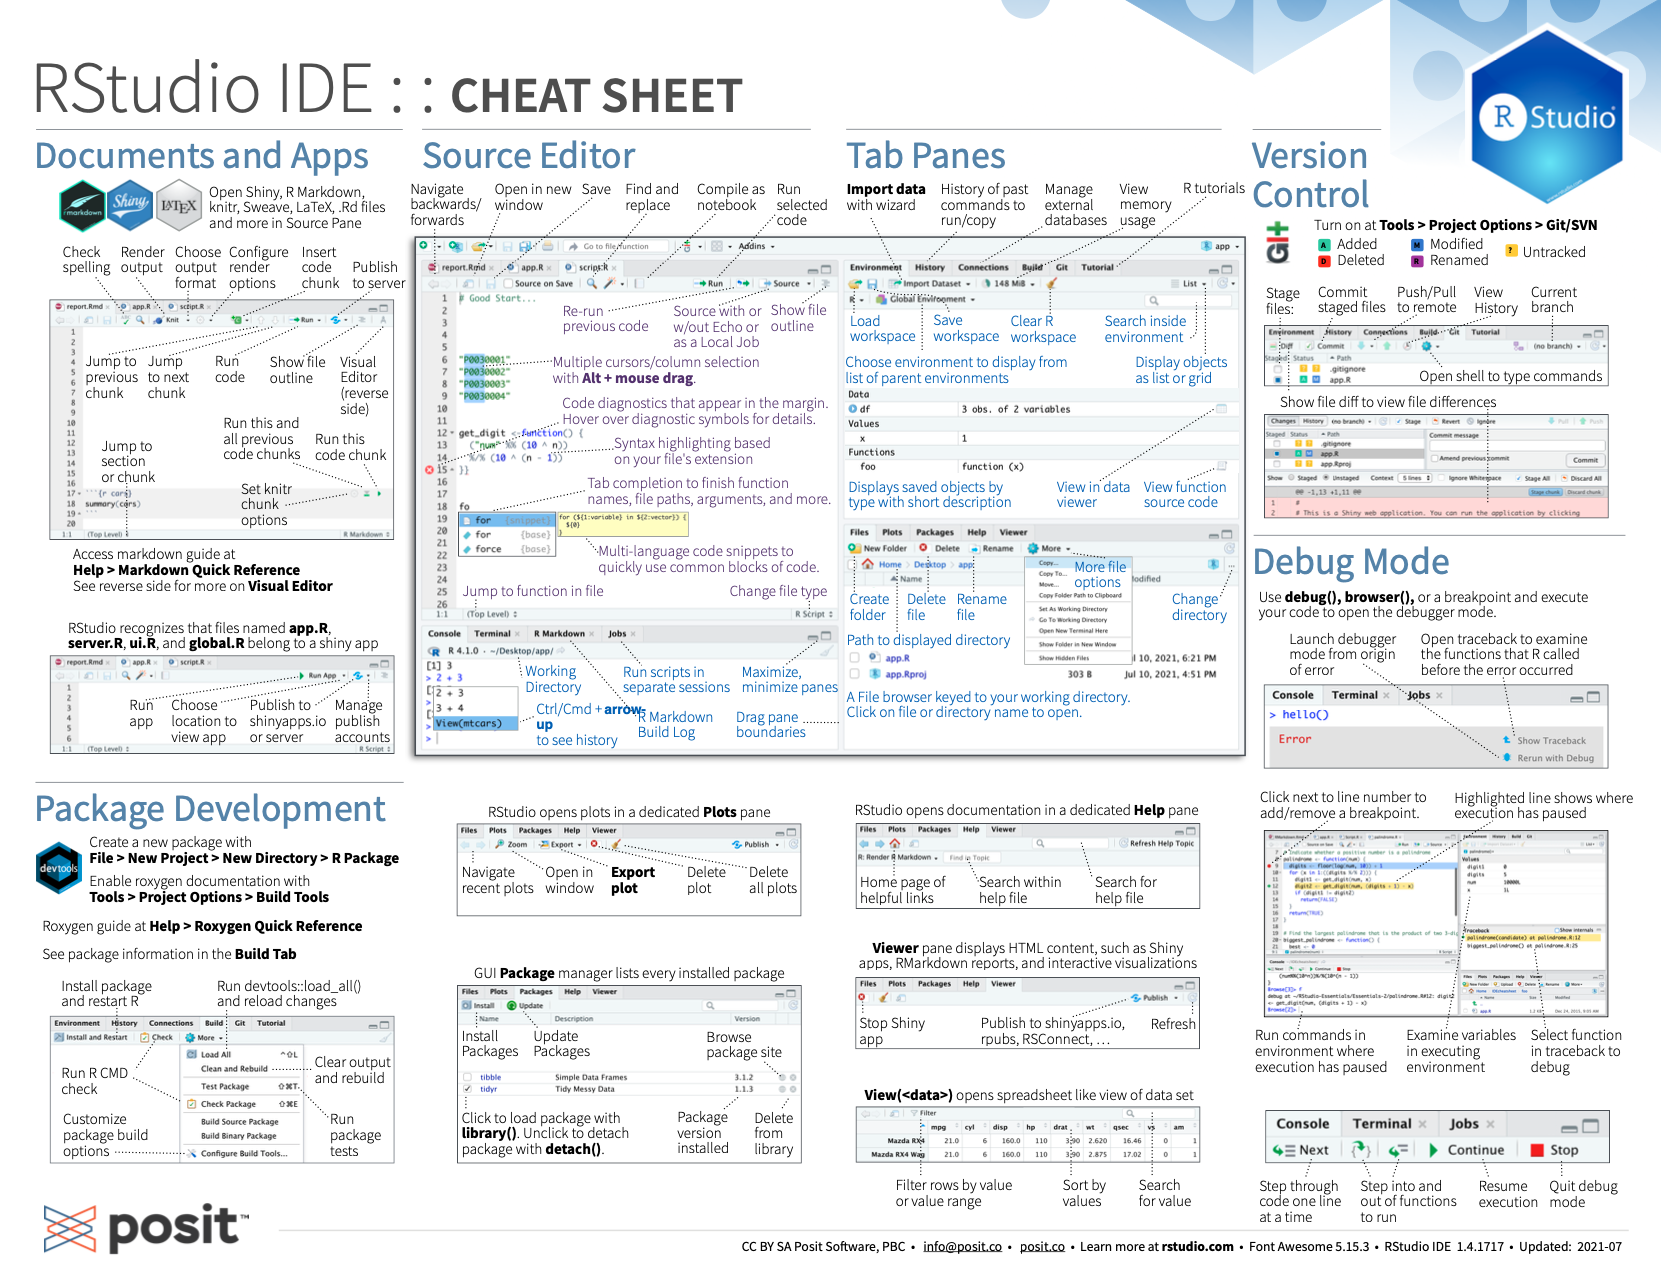
Figure 0.1: The RStudio IDE cheat sheet (from Posit cheatsheets).
A very useful feature of the RStudio IDE is that collections of files can be combined into projects. For instance, it makes sense to store everything related to this course in a dedicated directory on your hard drive (e.g., in a folder “i2ds”) and create an RStudio project (also named i2ds) that uses this directory as its root. An immediate benefit of using projects is that your entire workflow gets more organized.5
Readings
This i2ds book is still being written and revised and is likely to change frequently. Although it provides solid and useful information, it will remain fragmentary and in flux for the foreseeable future. Additionally, we occasionally point to other books for specific topics and materials. For instance, the more stable textbook Data Science for Psychologists (Neth, 2025a) caters to the special needs of social science students:
![]()
- Neth, H. (2025). ds4psy: Data Science for Psychologists.
Social Psychology and Decision Sciences, University of Konstanz, Germany.
Textbook and R package (version 1.1.0, September 12, 2025).
Retrieved from https://hneth-ds4psy.share.connect.posit.cloud/.
doi 10.5281/zenodo.7229812
- The corresponding R package ds4psy (Neth, 2025b) is available at https://CRAN.R-project.org/package=ds4psy and also used in this book and course.
Based on Data Science for Psychologists (ds4psy)
This book is based on the book Data Science for Psychologists and also uses the R package ds4psy (Neth, 2025b) and corresponding course materials. Relying on these ds4psy materials makes sense for many topics, as the overlap of important concepts and tools is substantial. Rather than repeating entire sections here, we will avoid redundancies by providing links whenever appropriate.
At the same time, the goals and focus of the present i2ds course is more ambitious and more general. Beyond addressing a wider scope of target audiences (including students of all disciplines), we also dedicate more space and time to reflections and critical thinking. Whereas the ds4psy textbook and course essentially covers one topic (and corresponding R package) per chapter, this book contains shorter and more focused chapters, arranges them in different order, and combines them into larger parts.
Whereas most other books on data science may dive deeper into technical details, this text provides more background information and puts data- and tool-related concepts into a theoretical perspective (known as ecological rationality, see Chapter 1). On the surface, this may seem like covering additional content and proceeding at a slower pace. However, we believe that reflecting on conceptual foundations is a worthwhile investment. By opting for a two-semester curriculum (e.g., basic skills and tools vs. applications), we aim to promote a more comprehensive understanding of data science.
Some distinguishing features of this i2ds book and course include:
![]()
- starting with literate programming and reproducible research (and using R Markdown)
- reflecting on the concepts of data, representations, visualizations, etc.
- devoting several initial sessions on R basics (using base R)
- devoting several sessions on visualizations (including a chapter on color)
- using data from the i2ds online survey in chapters and exercises (in progress)
- covering a range of applications (including simulations, models, and R Shiny applications)
Overall, the materials of the ds4psy textbook are still useful, but using this i2ds textbook is recommended.
Other textbooks
Several additional sources are freely available online:
The textbooks R for Data Science and its 2nd edition (Wickham, Çetinkaya-Rundel, et al., 2023; Wickham & Grolemund, 2017) provide a classic, but more technical and tidyverse-centric introduction to data science:
Wickham, H., & Grolemund, G. (2017). R for data science: Import, tidy, transform, visualize, and model data. Sebastopol, Canada: O’Reilly Media, Inc. [Available at http://r4ds.had.co.nz.]
Wickham, H., Cetinkaya-Rundel, M. & Grolemund, G. (2023). R for data science: Import, tidy, transform, visualize, and model data (2nd edition). Sebastopol, Canada: O’Reilly Media, Inc. [Available at https://r4ds.hadley.nz/.]
Where it makes sense, we will point to parts of related textbooks (e.g., Baumer et al., 2021; Ismay & Kim, 2020; James et al., 2021):
- Baumer, B. S., Kaplan, D. T., & Horton, N. J. (2020).
Modern Data Science with R (2nd ed.).
CRC Press, Taylor & Francis Group, Boca Raton/London/New York.
[Available at https://beanumber.github.io/mdsr2e/.]
- Ismay, C., Kim, A. Y., & Valdivia, A. (2020, 2025).
Statistical inference via data science: A ModernDive into R and the tidyverse.
[Available at https://moderndive.com or https://moderndive.com/v2/.]
- James, G., Witten, D., Hastie, T., & Tibshirani, R. (2021).
An introduction to statistical learning (2nd edition). Springer, New York, NY.
Available at https://www.statlearning.com.
Literate programming
This book assumes that sound thinking and solid methodological skills are conditions for creative work in both scientific and applied disciplines. A key virtue to be learned and exercised on the path from novice to expert is that of transparent communication.
Beyond knowledge on using R and various R packages for analyzing data, one of the most important skills conveyed in this course — and one that remains relevant far beyond the topic of data science — is called literate programming (Knuth, 1984): Literate programming is a paradigm for working with computers that concerns how we write both text and computer code. Its basic goal is to design a system that enables distinctions between data types (e.g., between text and code) in order to treat them appropriately (e.g., typeset text and evaluate code), and ultimately merge their results (e.g., computations, text, figures, and tables). Conceptually, a key idea when engaging with literate programming is to separate form from content — and prioritizing content over form while creating new material. (See Wikipedia: Literate programming for background information.)
Practically, adopting this paradigm requires some skills and tools that may seem awkward and unfamiliar at first, but are easily acquired — and likely to change our lives by enabling countless opportunities.6 In this course, the main tool that allows weaving text and code together in a single document is R Markdown (which is maintained by the developers of the RStudio IDE mentioned above).
For our purposes, literate programming will allow us to take a step towards reproducible research (see Section 1.3). As a first approximation, reproducible research is a methodology to ensure that others can understand and re-create a document. Thus, reproducible research practices and promotes transparency in science. For instance, when analyzing a set of data or completing exercises on some topic, we will learn to create files that explicate all intermediate steps and can be transformed into a variety of output formats. Given the right tools, making research reproducible is not difficult, but requires an initial effort and regular practice. To turn a good idea into a habit, we will start using corresponding tools in our very first session. As we will see in Chapter 1, distinguishing between content and form makes it easy to create well-formatted documents for a variety of purposes. This will enable students not only to submit exercise solutions, but also to write research reports, blogs, and academic theses.7
Ready, steady, …
But with all these preliminaries out of the way, we are ready to embark on our data science journey and the chapters of Part 1: Foundations.
ADILT denotes the Advanced Data and Information Literacy Track at the University of Konstanz.↩︎
The survey data is provided as
i2ds_surveyof the R package ds4psy (Neth, 2025b). By January 2026, 60 individuals have completed the survey and shared their data.↩︎Installing RStudio includes many additional R packages. Two key packages we will use extensively are knitr (Xie, 2025) and rmarkdown (Allaire et al., 2025).↩︎
The notion of “free software” usually abstracts from the costs of our time, our computer, and the context that enable us to use some software. Note that these costs can be substantial and should caution us against wasting time and energy on bad software. Alas, paying hard cash for software also provides no guarantee for receiving a better products or services. See the arguments of the Free Software Foundation (FSF) for a non-profit perspective on software products.↩︎
See the introductory chapters of R for Data Science, ideally in its 2nd edition (Wickham, Çetinkaya-Rundel, et al., 2023; Wickham & Grolemund, 2017) for short, but helpful instructions on organizing your workflow with the RStudio IDE — especially the “Workflow” chapters basics (Chapter 3), style (Chapter 5), scripts and projects (Chapter 7), and getting help (Chapter 9).↩︎
For instance, this site and many other books, reports, and websites are created within this paradigm.↩︎
For concrete instructions on combining text and code in R, see Section 1.3.3 and Chapter 27: R Markdown of the r4ds textbook (Wickham & Grolemund, 2017), or Appendix F: Using R Markdown of the ds4psy textbook (Neth, 2025a).↩︎