15 Exploring data
Exploratory data analysis (EDA) is a fancy name for an ordinary, but important phase of any data analysis. Whereas the primary goal of EDA is to develop an understanding of our data, a secondary goal is to proceed in a transparent and reproducible fashion.
From a technical viewpoint, EDA is where our skills in transforming, reshaping, and visualizing data meet. Hence, we will use a mix of base R functions and additional tools from the dplyr, tidyr, and ggplot2 packages to become familiar with a dataset.
Preparation
Recommended background reading for this chapter is:
of the ds4psy book (Neth, 2025a). This chapter exemplifies the principles of an EDA using the Positive psychology data (Woodworth et al., 2017, 2018) included in the ds4psy package.
See
of the r4ds book (Wickham & Grolemund, 2017) for an EDA of ggplot2’s diamonds data.
Preflections
Before reading, please take some time to reflect upon the following questions:

What are the first steps of any data analysis?
Which questions should we always ask before conducting any statistical test?
What is the difference between generating and testing hypotheses?
15.1 Introduction
When promoting tools and skills of data analysis, we easily forget that we usually explore data without being interested in this data. This seemingly paradoxical situation is explained by the fact that data usually is a means to an end, rather than an end in itself. Our reason for seeking data in the first place is that we deeply care about some issue or topic. In contexts of scientific research, we usually operate within a theoretical framework of concepts and hypotheses regarding their relations to each other. Even if our theoretical ideas may still be vague, we should be able to formulate well-defined research questions. If those questions are of an empirical nature, data is collected to address and answer them.
But even when data is generated or recruited as a means for answering questions, it can also generate new questions. Thus, theoretical questions and data are the two poles of an iterative cycle that inspire and motivate each other. Figure 15.1 illustrates the mutual influence of questions and data:
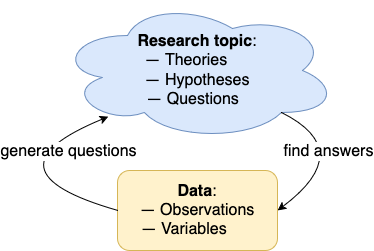
Figure 15.1: The hermeneutic cycle of exploratory data analysis (EDA): Data is used as a means for answering and for generating research questions.
Precisely how our expectations shape what we seek and recognize as data, and how this in turn affects our thinking is the domain of hermeneutics, which is the study of how we perceive and interpret evidence (see the corresponding definitions in Wikipedia or The Stanford Encyclopedia of Philosophy for details).
As with most topics in this book, we can distinguish between the theoretical and the practical aspects of EDA. The two main sections of this chapter will be devoted to these topics:
Section 15.2 explores conceptual issues by comparing different definitions of EDA
Section 15.3 provides practical guidelines in the form of principles and recommendations
Overall, EDA is a key component of any data analysis. While the influence of data on shaping our thinking by generating new questions must not be underestimated, the primary purpose of analyzing data lies in answering our theoretical questions. In practice, EDA is our way to get a grip on a set of data.
15.2 What is EDA?
Note: This section summarizes some conceptual issues of EDA. For a longer version, see Chapter 4: Exploring data of the ds4psy book (Neth, 2025a).
We can distinguish between three main discussions and interpretations of exploratory data analysis (EDA):
- EDA as the opposite of (or complement to) confirmatory data analysis:
Exploratory data analysis (EDA) is a type of data analysis that John Tukey contrasted with confirmatory data analysis (CDA) (e.g., Tukey, 1977, 1980) and likened it to the work of a detective (Tukey, 1969). Long before the ubiquity of personal computers, Tukey emphasized the importance of visual displays for detecting patterns or irregularities in data, while most psychologists of the same era were obsessed with statistical rituals (like null hypothesis significance testing, NHST, see Nickerson, 2000) of a rather mechanistic and mindless nature (Gigerenzer, 2004). Irrespective of your stance towards statistics, EDA approaches data in a more curious and open-minded fashion.
- EDA as an attitude or mindset:
Exploratory data analysis is an attitude,
a flexibility, and a reliance on display,
NOT a bundle of techniques, and should be so taught.John W. Tukey (1980, p. 23)
EDA is partly motivated by the philosophical idea of gaining insight by hermeneutics: EDA is a data scientist’s way of doing hermeneutics — see the corresponding definitions in Wikipedia or The Stanford Encyclopedia of Philosophy for details — to get a grip on some dataset.
- EDA as the initial phase of an analysis process:
EDA is part of an inevitable process to familiarize us with new data. Our goals during this phase is in detecting potential problems and irregularities, discovering patterns, and formulating better questions.
The goal of EDA is to discover patterns in data. (…)
The role of the data analyst is to listen to the data in as many ways as possible
until a plausible “story” of the data is apparent, even if such a description
would not be borne out in subsequent samples.John T. Behrens (1997, p. 132)
If a good exploratory technique gives you more data, then maybe
good exploratory data analysis gives you more questions, or better questions.
More refined, more focused, and with a sharper point.Roger Peng (2019), Simply Statistics
Having gained an understanding of what EDA is and wants, we are curious to learn how to do an EDA.
15.3 Essentials of EDA
As any exploration depends on the data to be explored, there are no general recipes for EDA. However, we can collect a set of good practices and recommendations.
Section 4.2 Essentials of EDA of the ds4psy book (Neth, 2025a) provides the following list:
15.3.1 The principles of EDA
As a quick summary, here are the 10 principles of EDA mentioned in Section 4.2 Essentials of EDA:
Goals and strategy
When analyzing data, we simultaneously pursue two general goals:
- Gain an understanding of our data; and
- Proceed in a reproducible fashion.
As data analysis never happens in a vacuum, we usually aim to answer some question. Whereas gaining insights may primarily motivate us, the goal of being reproducible concerns how we work. Our key strategy for ensuring reproducible research is being explicit and transparent. To succeed in both goals, we explain
- what we are doing and
- why we are doing it, and
- how we are doing it (e.g., which tools we are using).
The following guidelines provide recommendations on how we should proceed.
A: Prepare
- Start with a clean slate: A fresh start can be achieved by explicitly
- Deleting any pre-defined objects (in your R environment)
- Showing R’s current working directory (e.g., by evaluating
getwd()) - Loading all required software packages
- Loading all required data file(s)
Example of an initial code chunk:
# Housekeeping: ----
rm(list = ls())  # clean current R environment

# Show current path / working directory: ----
wd <- getwd()
paste0("Working directory: ", wd)

# Load required R packages: ----
library(knitr)
library(rmarkdown)
library(tidyverse) # for dplyr, ggplot2, tidyr...
library(ds4psy)    # for data files
library(unikn)     # for color functions
# library(here)    # for path information

# Load data file(s): ----
df <- ds4psy::falsePosPsy_all
df- If an analysis includes any random elements (e.g., by using
sample()), we should sure to useset.seed()to make our results reproducible:35
# If analysis includes random elements:
set.seed(101) # for reproducible randomness- Provide session info (e.g., by evaluating
sessionInfo()at the end of your document)
Example of a final code chunk:
# Session info: ----
utils::sessionInfo()- Be clear: Structure, document, and comment your analysis
- Structure content into sections and sub-sections
- Provide short text statements on goals, interpretations, and conclusions
- Provide comments on what and why you are doing
Create filter variables to identify sub-sets of observations
Stay safe: Make copies (and copies of copies) of your data
B: Inspect
Know your data (variables, values, and observations)
Know the distributions of variables (mean tendency, variation, vs. shape)
Know and deal with unusual variables and values (missing or extreme values)
C: Understand
Inspect trends over time or repeated measurements
Inspect relationships between key variables
Create transparent visualizations
In Section 4.2 Essentials of EDA, these principles are illustrated in the context of some data collected in an investigation on the benefits of positive psychology interventions (described in Appendix B1).
15.3.2 Caveat: Explaining vs. predicting in science
Discovering some pattern in data is usually interesting and exciting. However, me must be very careful to avoid drawing premature conclusions from it. Importantly, any observed relationship between variables could be spurious, merely due to chance fluctuations. Hence, before getting carried away by discovering some pattern in our data, we must always keep in mind:
- Science 101: To really find something, we need to predict it — and ideally replicate it under different conditions.
Thus, taking into account the principles of EDA does never guarantee any results, but provides valuable insights into the structure and contents of a dataset. Gaining such insights before embarking on statistical tests minimizes the risk of missing something important or violating key assumptions. However, EDA does not replace solid research design and sound practices of inferential statistics.
15.4 Conclusion
15.4.1 Summary
Definition
What is exploratory data analysis (EDA)?
Three possible interpretations are:
- A complement to confirmatory data analysis;
- an attitude or mindset (allowing for insights based on hermeneutics);
- a process to familiarize us with new data, detect patterns, and formulate better questions.
Principles
Instead of a fixed recipe, we collected 10 principles of EDA:
Summary: Good principles and practices of EDA
A: Prepare
- Start with a clean slate and explicitly load all data and all required packages
- Be clear: Structure, document, and comment your analysis
- Create filter variables to identify and select sub-sets of observations
- Stay safe: Make copies (and copies of copies) of your data
B: Inspect
- Know your data (variables, values, and observations)
- Inspect the distributions of variables
- Know and deal with unusual variables and values
C: Understand
- Inspect trends over time or repeated measurements
- Inspect relationships between variables
- Create transparent visualizations
From a technical viewpoint, EDA involves a combination of base R data structures and commands, and is facilitated by additional tools from the dplyr, tidyr, and ggplot2 packages.
15.4.2 Resources
See the pointers to related resources at Section 4.5 Resources.
- Know your data. Really, really, know it (by Randy Au, 2019-02-15)
15.4.3 Preview
This chapter on exploring data concludes the current Part 4 on Wrangling data. The following Part 5 will examine Special data types (e.g., numbers vs. factors, text and time-based data).
15.5 Exercises

The following exercises motivate further explorations of data.
A: Using the positive psychology data
Exercises 15.5.1 to 15.5.4 link to Section 4.4 Exercises of the ds4psy book (Neth, 2025a). The corresponding chapter 4: Exploring data uses the Positive psychology data (Woodworth et al., 2017, 2018) that are included in the ds4psy package. (See Section B.1 of Appendix B: Datasets and sources for details on this data.)
15.5.5 Exploring false positive psychology data
Explore the False positive psychology data (Simmons et al., 2011, 2014) that are included in the ds4psy package. (See Section B.2 of Appendix B: Datasets and sources for details on this data.)
Hint:
The tibble falsePosPsy_all contains the data from two studies.
Begin by examining the participant characteristics of both studies. Are they similar or do they differ?
What are independent and dependent variables of both studies?
15.5.6 Find and explore some interesting data
Find some online data that is of interest to you and explore it in a way that conforms to the principles advocated by this chapter.
- Which question(s) can be answered by this data?
- What are key variables?
- What are key relations?
- What hypotheses or conclusions are suggested by your exploration?
Hint: Try finding data on a topic that really interests you. A good place to start searching for online data is Appendix B.3.3: Online sources of the ds4psy book.
In practice, it often makes sense to keep things random during development (so that you do not bias your results on a particular seed value), but then set a fixed seed value when sharing your results. This way, your audience can both replicate your results and explore alternative seed values.↩︎