12 Using tibbles
Having learned how to import data into R (in Chapter 11), we now take a closer look at the rectangular data structure known as a tibble, which is a simplified version of an R data frame. After briefly comparing tibbles to data frames, the key topic of this chapter is to create tibbles from other data structure by the tibble package (Müller & Wickham, 2026).
Tibbles are the main rectangular data structure used in the tidyverse (Wickham et al., 2019). When using only base R, we could get by just fine by only using data frames, rather than tibbles. But tibbles have some advantages that make them more convenient and sometimes safer to use.
Preparation
Recommended readings for this chapter include
- Chapter 10: Tibbles of the r4ds book (Wickham & Grolemund, 2017)
- Chapter 7: Data import of the 2nd edition of r4ds (Wickham, Çetinkaya-Rundel, et al., 2023)
- Chapter 5: Tibbles of the ds4psy book (Neth, 2025a).
Preflections
Before reading, please take some time to reflect upon the following questions:
How can we turn an R data frame into a tibble?
How can we turn non-rectangular data (e.g., individual vectors) into a tibble?
How can we enter data from scratch?
As tibbles make our lives easier, these questions correspond to three simple tibble functions.
12.1 Introduction
Data is rarely entered directly into R. When we analyze data, getting data into R can either imply
importing data from some file or server (see Chapter 11), or
creating data from scratch (see below).
In both cases, we aim to end up with rectangular data structure known as a “tibble”, which is a simplified type of data frame, used in the tidyverse (Wickham et al., 2019).
Key concepts
Key concepts of this chapter on creating tibbles include:
- rectangular data structures (with rows/cases and columns/variables)
- data frames vs. tibbles
- data types: logical, character, or numeric variables vs. factors
Resources
Resources for this chapter on creating tibbles include:
- The R package tibble (Müller & Wickham, 2026)
- data from base R datasets and additional packages:
12.2 Using tibbles
Tibbles are rectangular data structures. But we already have and use a rectangular data structure in R: In Chapter 3 on Data structures, we learned to combine vectors of the same length into data frames. When we now introduce a new construct and term, our first question must be:
- How does a tibble differ from a data frame?
And if it turns out that there are good reasons for using a tibble to store data, we then can ask:
- How can we create tibbles from other data structures?
The following sections answer these questions.
12.2.1 Tibbles vs. data frames
In Chapter 3 on Data structures, we combined vectors of the same length into a special type of rectangular data structure that was called a data frame. Internally, data frames are represented as a list of vectors and their elements (i.e., cells, columns, or rows) and can be accessed by logical or numeric subsetting. Whenever we loaded (i.e., parse or read) rectangular data into R, a desirable data structure of the resulting object was a data frame.
Whereas data frames appeared in base R in the 1990s (and are a legacy of the S programming language on which R is based), tibbles first appeared in the dplyr package and in the form of an R tibble package (v1.0) in 2016.
Tibbles are simple data tables and the primary way of representing data (in rows of cases and columns of variables) in the tidyverse (Wickham, 2023). Internally, tibbles are a special, simplified form of a data frame.
While tibbles are simpler data frames, they differ in their default behavior and some details. In contrast to the base R behavior of data frames, turning data into tibbles is more restrictive. Specifically,
tibbles do not change the types of input variables (e.g., strings are not converted to factors);
tibbles do not change the names of input variables and do not use row names.
While the default behavior of tibbles is more restrictive, tibbles are still flexible, e.g., by also allowing for non-syntactic variable (column) names. For instance, in contrast to data frames, the variable names in tibbles can start with a number or contain space characters:
tb <- tibble(
  `1 age` = c(17, 33, 28, 23, 15),
  ` sex` = c("m", "f", "f", "m", "?")
)
tb
#> # A tibble: 5 × 2
#>   `1 age` ` sex`
#>     <dbl> <chr>
#> 1      17 m
#> 2      33 f
#> 3      28 f
#> 4      23 m
#> 5      15 ?
To refer to names with such unorthodox spellings, they need to be enclosed in backticks ` `.34 But variable names in backticks quickly get cumbersome, for instance:
# Refer to non-syntactic names:
tb$`1 age`
#> [1] 17 33 28 23 15
tb$` sex`[2]
#> [1] "f"

# Transforming data:
tb %>%
  filter(`1 age` > 17) %>%
  arrange(`1 age`)
#> # A tibble: 3 × 2
#>   `1 age` ` sex`
#>     <dbl> <chr>
#> 1      23 m
#> 2      28 f
#> 3      33 f
The precise differences between tibbles and data frames are not important to us at this point.
(The main differences concern printing, subsetting, and the recycling behavior of vector elements when creating tibbles. See vignette("tibble") for details.)
For our present purposes, tibbles are preferable to data frames, as they are easier to understand, easier to manipulate, and thus reduce the chance of problems or unpleasant surprises.
12.2.2 Creating tibbles
In Chapters 2 and 3, we emphasized that any data object in R has a type and shape. The combination of both is usually defined as a data structure. Hence, when aiming to create a tibble, we need to ask ourselves:
- From which existing data structure(s) do we want to create a tibble?
More specifically, how can we create tibbles from other data structures (e.g., vectors or data frames)? And what can we do when we do not yet have an R object, but want to create a tibble from scratch?
The three key functions discussed in this chapter differ by the types of inputs they expect, but have in common that they create a tibble as their output. Key tibble functions include:
as_tibble()converts (or coerces) an existing rectangle of data (e.g., a data frame or matrix) into a tibble.tibble()converts several vectors into (the columns of) a tibble.tribble()converts a table of text (entered row-by-row) into a tibble.
While some R veterans may prefer data frames, tibbles are becoming increasingly popular.
And if we ever have to transform a tibble tb into a data frame, we can always use as.data.frame(tb).
From rectangular data structures
The as_tibble() function converts (or coerces) an existing rectangle of data (e.g., a data frame or matrix) into a tibble. Both cases are simple and straightforward:
- From a data frame
The very first data frame we created in Section 3.4.3 described five people:
# 3 variables (as vectors):
name   <- c("Adam", "Ben", "Cecily", "David", "Evelyn")
gender <- c("male", "male", "female", "male", "other")
age    <- c(21, 19, 20, 48, 45)

(df <- data.frame(name, gender, age))
#>     name gender age
#> 1   Adam   male  21
#> 2    Ben   male  19
#> 3 Cecily female  20
#> 4  David   male  48
#> 5 Evelyn  other  45
Using as_tibble() to turn an existing data frame into a tibble is simple:
(tb <- as_tibble(df))
#> # A tibble: 5 × 3
#>   name   gender   age
#>   <chr>  <chr>  <dbl>
#> 1 Adam   male      21
#> 2 Ben    male      19
#> 3 Cecily female    20
#> 4 David  male      48
#> 5 Evelyn other     45
Note that the data frame df and the tibble tb have the same contents and dimensions, but the data type of the tb.
- From a matrix
The first matrix we created in Section 3.4.1 turned a numeric vector into a
# Reshaping an atomic vector into a rectangular matrix:
(mx <- matrix(data = 1:20, nrow = 5, ncol = 4, byrow = TRUE))
#>      [,1] [,2] [,3] [,4]
#> [1,]    1    2    3    4
#> [2,]    5    6    7    8
#> [3,]    9   10   11   12
#> [4,]   13   14   15   16
#> [5,]   17   18   19   20
Using as_tibble() to turn an existing matrix into a tibble is easy:
(tb_2 <- as_tibble(mx))
#> # A tibble: 5 × 4
#>      V1    V2    V3    V4
#>   <int> <int> <int> <int>
#> 1     1     2     3     4
#> 2     5     6     7     8
#> 3     9    10    11    12
#> 4    13    14    15    16
#> 5    17    18    19    20
Note that the variables of tb_2 are of the numeric type integer (as was mx), but gained some default (column) names. These names are identical to those generated by as.data.frame(mx), but the default can be influenced by the .name_repair argument.
Practice
-
Convert some of the datasets included in R (e.g.,
datasets::attitude,datasets::mtcars, anddatasets::Orange) into a tibble and inspect their dimensions and contents.- What types of variables (columns of data) do they contain?
- What is their basic unit of observation (i.e., a row of data)?
- What types of variables (columns of data) do they contain?
Obtain the same information that you get by printing a tibble
tb(i.e., its dimensions, types of variables, and values of the first rows) about some data framedf. How many R functions do you need?-
Explore other sets of data provided by R packages (e.g., ds4psy, dplyr, or ggplot2):
- Are they data frames or tibbles (or some other data structure)?
- Convert some tibbles into data frames (or vice versa), and back.
From vectors
The tibble() function turns data that consists of a collection of vectors into a tibble.
Thus, tibble() is the tibble function that corresponds to data.frame() in base R.
In our example for turning a data frame into a tibble (above), we started with a set of three vectors:
# 3 variables (as vectors):
name   <- c("Adam", "Ben", "Cecily", "David", "Evelyn")
gender <- c("male", "male", "female", "male", "other")
age    <- c(21, 19, 20, 48, 45)
Rather than turning those into a data frame df and then using as_tibble(df), we could use the tibble() function to directly define a tibble tb:
# Create a tibble from vectors (columns):
tb <- tibble("name" = name,
             'self-described gender' = gender,
             age = age)

tb # prints the tibble:
#> # A tibble: 5 × 3
#>   name   `self-described gender`   age
#>   <chr>  <chr>                   <dbl>
#> 1 Adam   male                       21
#> 2 Ben    male                       19
#> 3 Cecily female                     20
#> 4 David  male                       48
#> 5 Evelyn other                      45
Note some details on using the tibble() function:
Each vector is labeled by a variable (column) name, which can be quoted (i.e., enclosed in double or single quotation marks) or not be quoted;
Avoid spaces within variable (column) names (or enclose names in quotes or backticks if we really
must use spacesin variable names);Consecutive vectors are separated by commas, but there is no comma after the final vector.
A general feature of R is that any vector is of a single data type (character, logical, numeric, or a factor of categorical values). However, note also that all vectors combined into the tibble tb had the same shape (i.e., length). This begs the question:
- What happens when the to-be-combined vectors are of different lengths?
Let’s try and find out:
# Data (as vectors of different length):
nr       <- 1:2
initials <- c("A.B", "N.N.", "U.N.", "X.Y.")
adult    <- TRUE

# Create a data frame:
data.frame(n = nr,
           i = initials,
           a = adult)
#>   n    i    a
#> 1 1  A.B TRUE
#> 2 2 N.N. TRUE
#> 3 1 U.N. TRUE
#> 4 2 X.Y. TRUE

# Create a tibble:
tibble(n = nr,
       i = initials,
       a = adult)
#> Error in `tibble()`:
#> ! Tibble columns must have compatible sizes.
#> • Size 2: Existing data.
#> • Size 4: Column `i`.
#> ℹ Only values of size one are recycled.
This example illustrates a difference in the default behavior of data.frame() and tibble():
Whereas data.frame() recycles its vectors to the length of the longest vector (as long as the length of the longest vector is a multiple of all shorter vectors), tibble() only recycles vectors of length 1 (i.e., scalars).
A neat feature when using tibble() for creating tibbles is that later vectors may use the values of earlier vectors:
# Using earlier vectors when defining later ones:
abc <- tibble(
  n    = 1:5,
  ltr  = letters[n],
  l_n  = paste(ltr, n, sep = "_"),  # combine ltr with n
  n_sq = n^2                        # square n
  )

abc  # prints the tibble:
#> # A tibble: 5 × 4
#>       n ltr   l_n    n_sq
#>   <int> <chr> <chr> <dbl>
#> 1     1 a     a_1       1
#> 2     2 b     b_2       4
#> 3     3 c     c_3       9
#> 4     4 d     d_4      16
#> 5     5 e     e_5      25
Overall, using tibble() on a collection of vectors is an easy and robust way for creating tibbles.
Practice
Show that scalars (i.e., vectors of length 1) are recycled when creating a tibble with
tibble(). For instance, in our example with vectors of unequal length (above), removing the linen = nrwould work without a warning, as the logical scalaradultwould be recycled to the length ofinitials.Use
tibble()to enter some information on your family (e.g., thename,age, and other features of a few family members) as a tibble.Find some tabular data online (e.g., on Wikipedia) and enter it as a tibble by applying
tibble()to a list of vectors.
From rows of data
The previous sections showed that we can easily convert data frames or vectors into tibbles. When we asked above
- How can we enter data from scratch?
we want to create a tibble, but do not yet have data as other R data structures. Thus, our current question is:
- How can we create tibbles from data that does not yet exist as R data structures?
But what data that is not an R data structure could we possibly want to enter as a tibble? Apart from importing data (see Chapter 11), we often encounter tabular data structures in text documents. For instance, Wikipedia contains many tables (usually rendered in HTML) that could be entered into R. Alternatively, the previous sections defined the following table:
| name | self-described gender | age |
|---|---|---|
| Adam | male | 21 |
| Ben | male | 19 |
| Cecily | female | 20 |
| David | male | 48 |
| Evelyn | other | 45 |
We created this table by using tibble() on three vectors, which then formed the columns of the tibble.
But when copying and pasting text, we could view the data as a collection of rows.
As most sets of data use rows for representing their units of observations (e.g., individual cars, people, penguins, etc.), entering them in this fashion often seems natural and straightforward.
The tibble package provides the tribble() function for entering observations (row-by-row) into a table. For instance:
# Create a tibble from text / observations (rows):
tb_2 <- tribble(
   ~name,  ~'self-described gender', ~age,
  #------|-------------------------|-----|
  "Adam",    "male",                  21,
  "Ben",     "male",                  19,
  "Cecily",  "female",                20,
  "David",   "male",                  48,
  "Evelyn",  "other",                 45
  )

tb_2 # prints the tibble:
#> # A tibble: 5 × 3
#>   name   `self-described gender`   age
#>   <chr>  <chr>                   <dbl>
#> 1 Adam   male                       21
#> 2 Ben    male                       19
#> 3 Cecily female                     20
#> 4 David  male                       48
#> 5 Evelyn other                      45
Note some details on using the tribble() function:
The column names are preceded by the tilde symbol
~and become the variable names of the tibble;Non-standard variable names are quoted (but should be avoided whenever possible);
Consecutive entries are separated by a comma, but there is no comma after the final entry;
The line
#------|-------------------------|-----|is commented out and thus can be omitted;The spacing within each row is optional (we chose to add extra spaces and align columns for clarity);
The type of each column is determined by the type of the corresponding cell values. For instance, the name and gender values are entered as quoted text (i.e., of data type character).
If tibble() and tribble() really are alternative commands, then the contents of our two tibbles tb and tb_2 should be identical:
# Verify equality:
all.equal(tb, tb_2)
#> [1] TRUEWorking with tibbles
The three key tibble functions are further illustrated in Section 5.2 Essential tibble commands of the ds4psy book (Neth, 2025a). Specifically, as tibbles are data frames, we can access their parts (columns, rows, or cells) by (numerical or logical) indexing, just as we do with data frames (see Section 5.2.4 Accessing tibble parts, for examples).
Turning tibbles into data frames
Finally, if we ever had to turn a tibble into a data frame, it is good to know that R has a as.data.frame() function that allows turning a tibble into a data frame:
(df <- as.data.frame(tb))
#>     name self-described gender age
#> 1   Adam                  male  21
#> 2    Ben                  male  19
#> 3 Cecily                female  20
#> 4  David                  male  48
#> 5 Evelyn                 other  45
12.3 Conclusion
For our purposes, tibbles are a simpler and well-behaved data frames. The tibble package (Müller & Wickham, 2026) provides functions for obtaining tibbles from other data structures (data frames, vectors, or tables provided as row-wise text).
12.3.1 Summary
This chapter discussed three key functions of the tibble package:
as_tibble()converts (or coerces) an existing rectangle of data (e.g., a data frame or matrix) into a tibble.tibble()converts several vectors into (the columns of) a tibble.tribble()converts a table of text (entered row-by-row) into a tibble.
While some R veterans may prefer data frames, tibbles are becoming increasingly popular (e.g., in tidyverse contexts).
And if we need to transform a tibble tb into a data frame, we can always use as.data.frame(tb).
Figure 12.1 repeats Figure 11.1 to summarize the roles of the readr and tibble packages: Both packages help to create tibbles, but differ in their input sources. Existing tibbles can be used for data analysis (e.g., for data transformations, visualizations, or statistics) or can be written to files (e.g., to be archived locally or shared online).
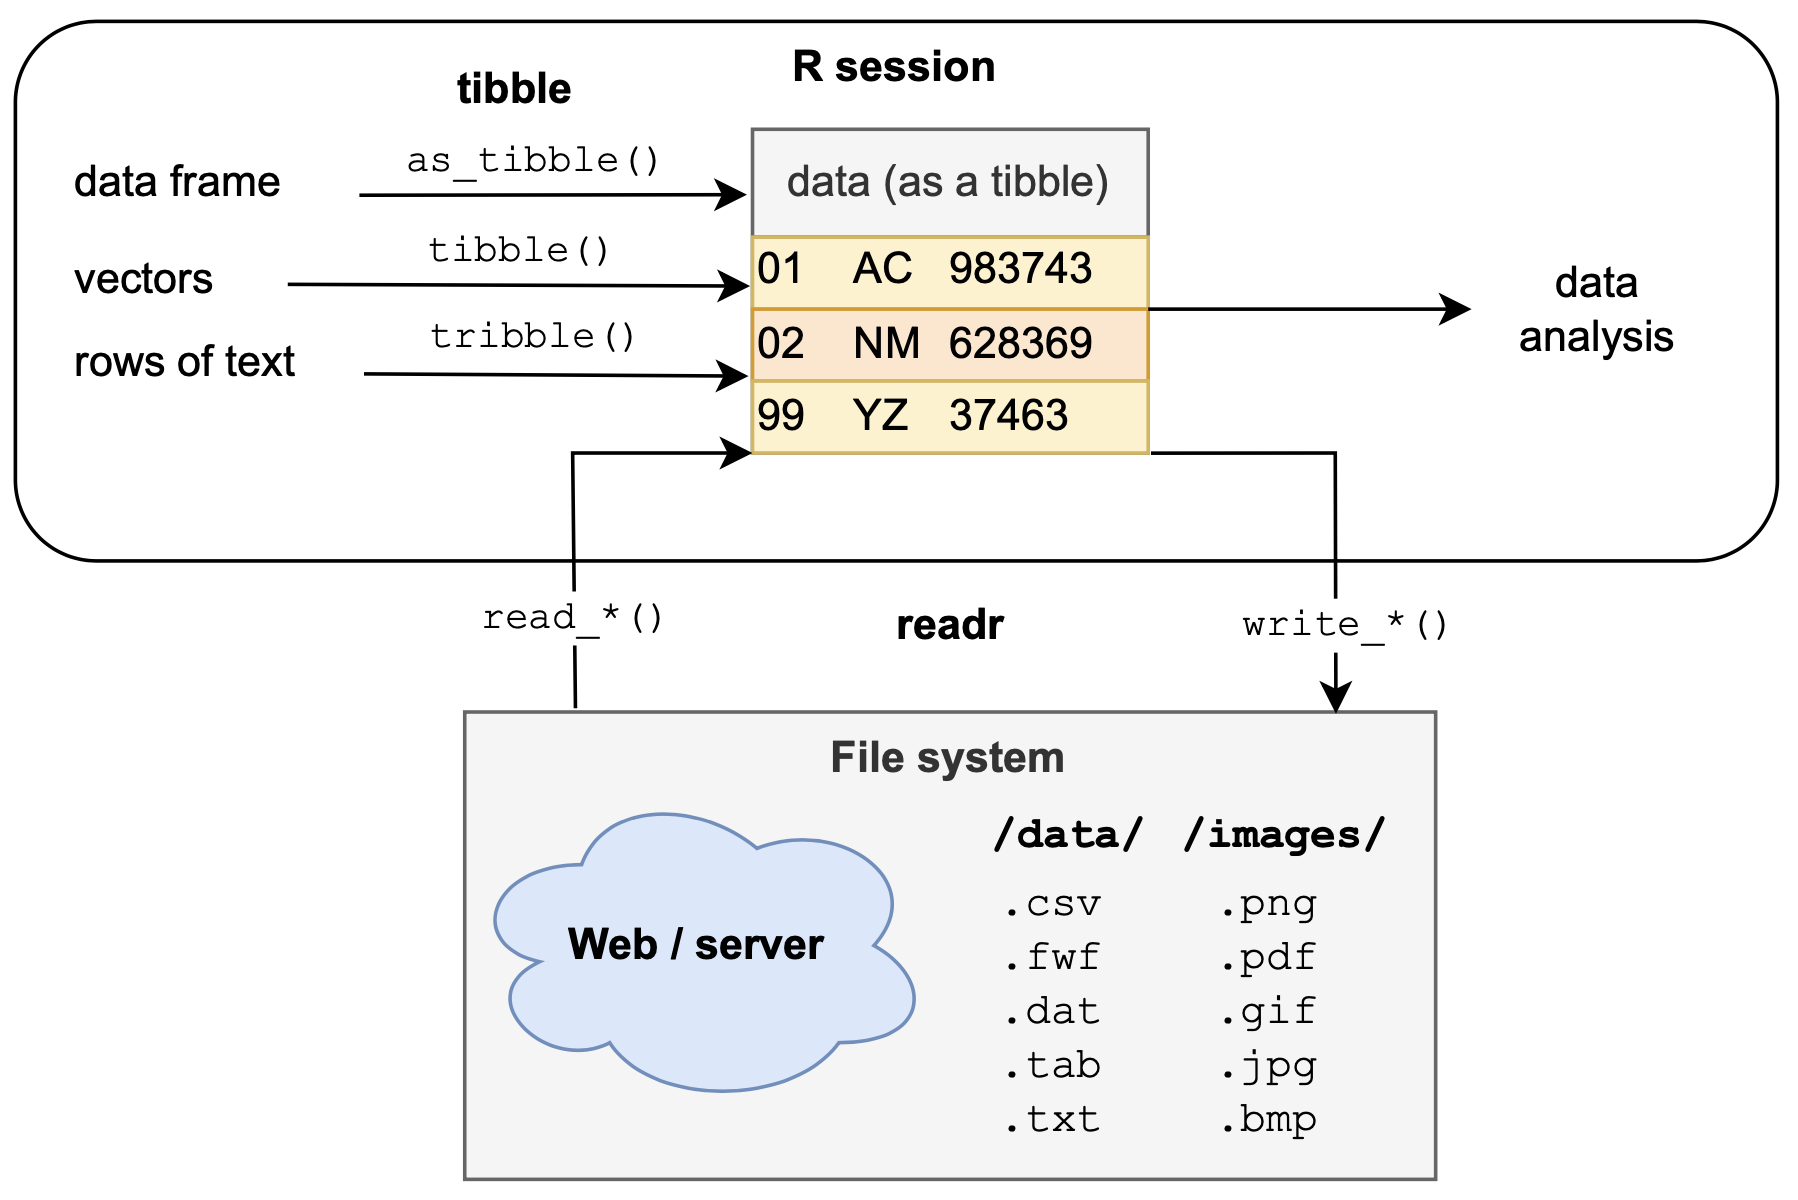
Figure 12.1: The readr and tibble packages use different inputs to create a tabular data structure known as a tibble, which is a simpler data frame. Tibbles can be then used for data analysis in R (e.g., for transforming or visualizing data, or statistical testing) or written to a file (e.g., for archival or sharing purposes).
12.3.2 Resources

Figure 12.2 shows the back of the cheatsheet on the tidyr package:
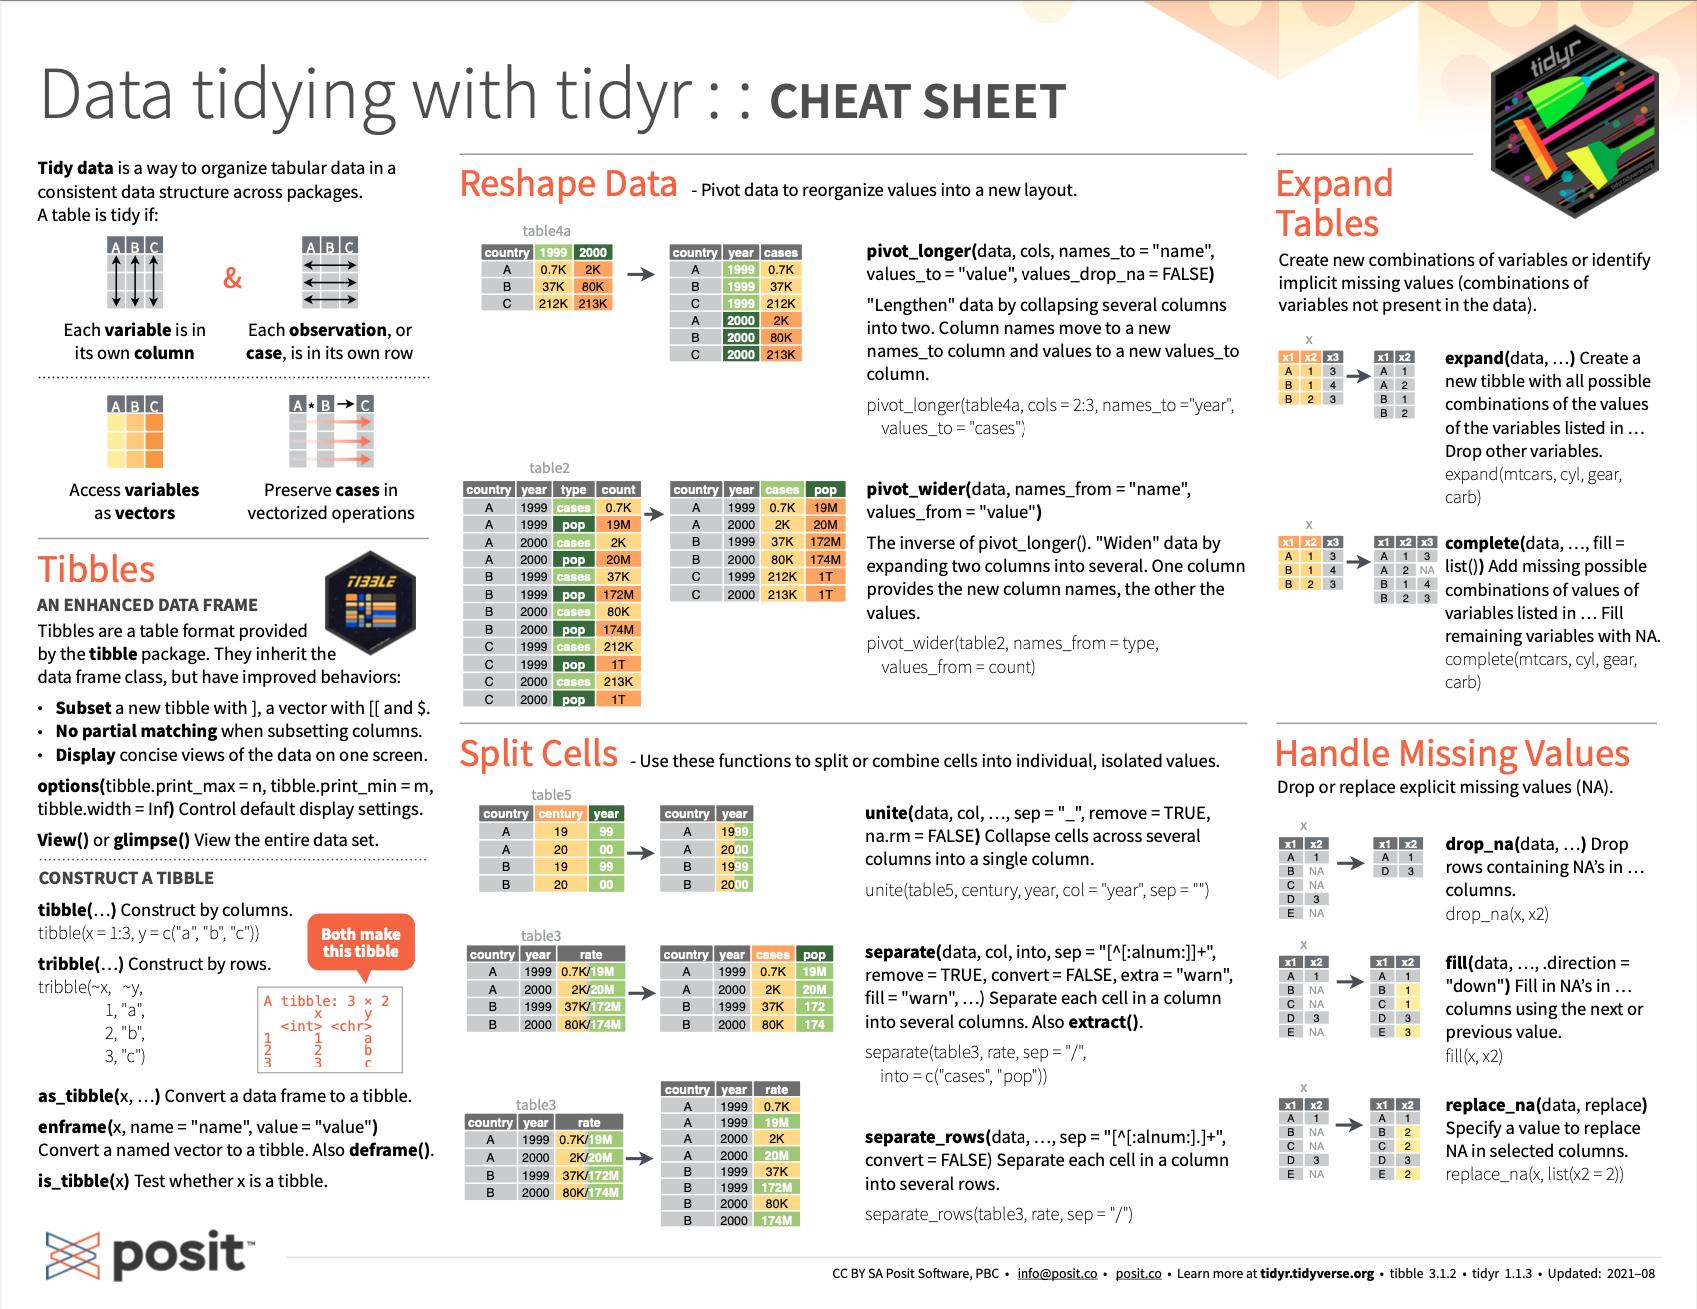
Figure 12.2: Essential tibble commands on the RStudio cheatsheet on the tidyr package.
The fact that both tibble and tidyr are covered by the same RStudio cheatsheet on Data tidying show the close correspondence between both topics.
12.3.3 Preview
The next two chapters will introduce the dplyr package and the tidyr package for data transformation. Just like readr and tibble, those packages are key components of the tidyverse (Wickham, 2023).
12.4 Exercises
The following exercises probe our conceptual and practical knowledge of tibbles:
12.4.1 Tibble terminology
In Figure 12.1, the term “tibble” appears repeatedly, but refers to three different constructs or objects. Distinguish between them and identify the corresponding referents.
Summarize the commonalities and differences between data frames and tibbles.
Describe the differences between
as_tibble(),tibble(), andtribble()in your own words.
Hint: Describe the three functions in terms of their inputs and outputs.
The following practical exercises link to the corresponding exercises of Chapter 5: Tibbles of the ds4psy book (Neth, 2025a).
12.4.2 Flower power
Parts 1, 3–5 (i.e., all except for Part 2) of Exercise 1
12.4.3 Rental accounting
Part 1 of Exercise 2
For compatibility reasons, we should still avoid variable names that do not start with a letter or contain spaces.↩︎