20 Day 20 (June 30)
20.2 Regression and ANOVA
- Review of the linear model
- Regression, ANOVA, and t-test as special cases of the linear model
- Write the regression and ANOVA model out on white board
20.3 ANOVA/F-test
F-test (pgs. 33 - 39 in Faraway (2014))
- The t-test is useful for testing simple hypotheses
- F-test is useful for testing more complicated hypotheses
- Example: comparing more than two means
library(faraway)
boxplot(weight ~ group, data=PlantGrowth,col="grey",ylim=c(0,7))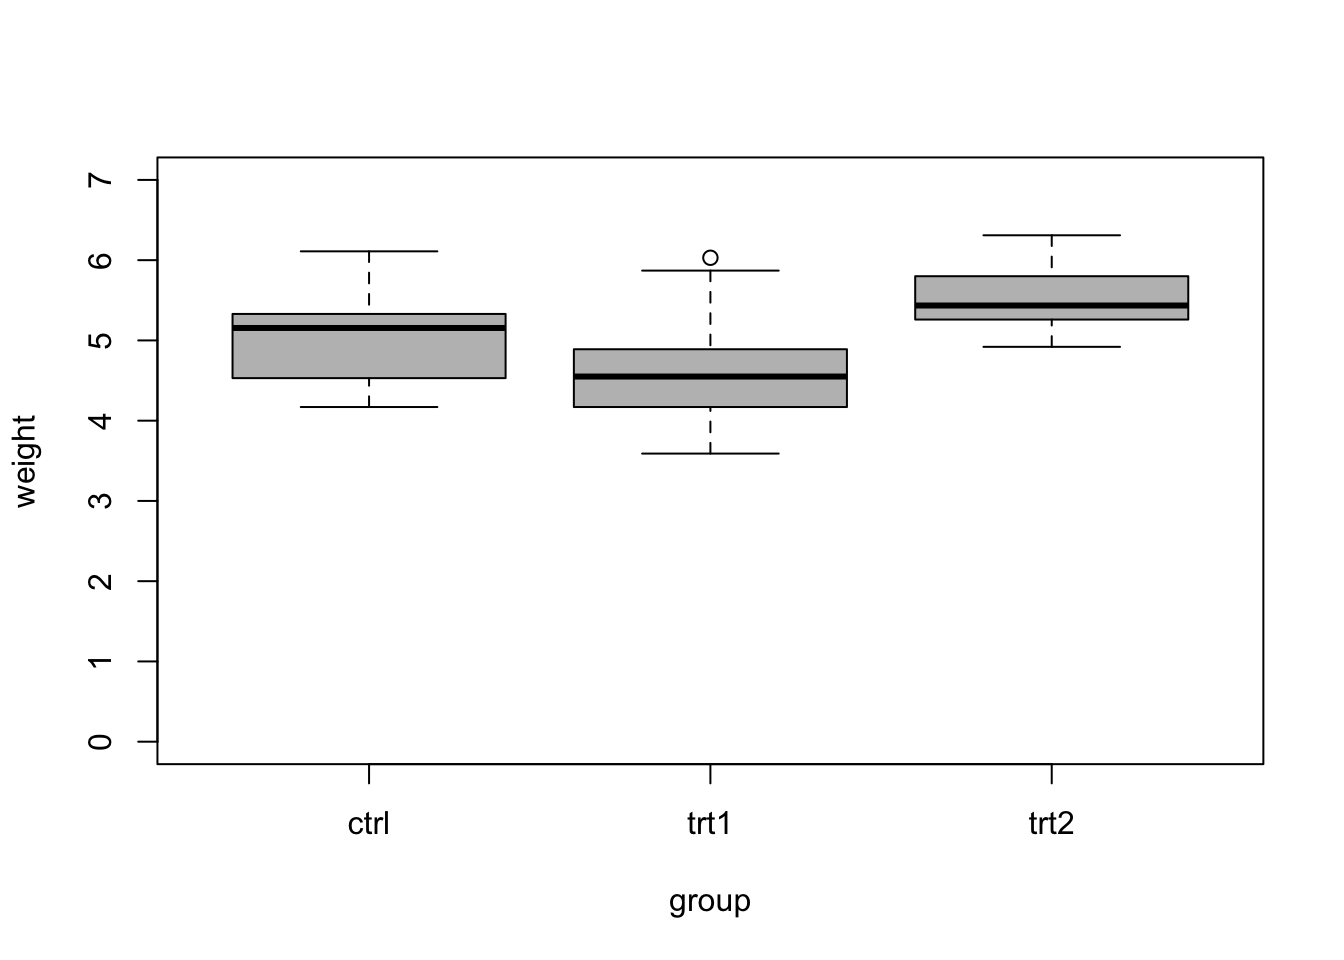
aggregate(weight ~ group, FUN=mean,data=PlantGrowth)## group weight ## 1 ctrl 5.032 ## 2 trt1 4.661 ## 3 trt2 5.526To determine if treatment 1 and 2 had an effects, we might propose the following null hypothesis \[\text{H}_{0}:\beta_1 = \beta_2 = 0\] and alternative hypothesis \[\text{H}_{\text{a}}:\beta_1 \neq 0 \;\text{or}\; \beta_2 \neq 0.\] To test the null hypothesis, we calculate the probability that we observe values of \(\hat{\beta_1}\) and \(\hat{\beta_2}\) as or more extreme than the null hypothesis. To calculate this probability, note that \[\frac{(TSS - RSS)/(p-1)}{RSS/(n-1)} \sim\text{F}(p-1,n-p).\] The probability that we observe a value of \(\hat{\beta_1}\) and \(\hat{\beta_2}\) as or more extreme than the null hypothesis can be written as \[\text{P}\bigg(\frac{(TSS - RSS)/(p-1)}{RSS/(n-1)} <F\bigg),\] where \(TSS = (\mathbf{y} - \bar{\mathbf{y}})^{\prime}(\mathbf{y} - \bar{\mathbf{y}})\) and \(RSS = (\mathbf{y} - \mathbf{X}\hat{\boldsymbol{\beta}})^{\prime}(\mathbf{y} - \mathbf{X}\hat{\boldsymbol{\beta}})\). The probability can be calculated as the area under the curve of a F-distribution. The code below shows how to do these calculations in R
m1 <- lm(weight ~ group,data = PlantGrowth)
summary(m1)
## ## Call: ## lm(formula = weight ~ group, data = PlantGrowth) ## ## Residuals: ## Min 1Q Median 3Q Max ## -1.0710 -0.4180 -0.0060 0.2627 1.3690 ## ## Coefficients: ## Estimate Std. Error t value Pr(>|t|) ## (Intercept) 5.0320 0.1971 25.527 <2e-16 *** ## grouptrt1 -0.3710 0.2788 -1.331 0.1944 ## grouptrt2 0.4940 0.2788 1.772 0.0877 . ## --- ## Signif. codes: 0 '***' 0.001 '**' 0.01 '*' 0.05 '.' 0.1 ' ' 1 ## ## Residual standard error: 0.6234 on 27 degrees of freedom ## Multiple R-squared: 0.2641, Adjusted R-squared: 0.2096 ## F-statistic: 4.846 on 2 and 27 DF, p-value: 0.01591anova(m1)## Analysis of Variance Table ## ## Response: weight ## Df Sum Sq Mean Sq F value Pr(>F) ## group 2 3.7663 1.8832 4.8461 0.01591 * ## Residuals 27 10.4921 0.3886 ## --- ## Signif. codes: 0 '***' 0.001 '**' 0.01 '*' 0.05 '.' 0.1 ' ' 1# "By hand" beta.hat <- coef(m1) X <- model.matrix(m1) y <- PlantGrowth$weight y.bar <- mean(y) n <- 30 p <- 3 RSS <- t(y-X%*%beta.hat)%*%(y-X%*%beta.hat) RSS## [,1] ## [1,] 10.49209TSS <- t(y-y.bar)%*%(y-y.bar) TSS## [,1] ## [1,] 14.25843TSS-RSS## [,1] ## [1,] 3.76634F <- ((TSS - RSS)/(p-1))/(RSS/(n-p)) F## [,1] ## [1,] 4.846088pf(F,p-1,n-p,lower.tail=FALSE)## [,1] ## [1,] 0.01590996Live example