13 Day 13 (June 21)
13.2 Understanding confidence intervals using synthetic data
What should we expect from a confidence interval?
- What is the statistic?
- Which quantities are random and which are fixed?
- How often should a 95% CI covers the true value of \(\beta\)?
How do we know if a CI performs as advertised?
- Derive the CI theoretically
- Evaluate the interval estimator using Monte Carlo simulation
Monte Carlo simulation to evaluate a CI
library(latex2exp)
library(plotrix)

beta.truth <- c(3,1) # True value of beta
sigma2.truth <- 1000     # True value of sigma2


n <- 50 # Sample size for each simulated data set
x <- seq(1,100,length.out = n) # Covariate
X <- model.matrix (~x) # Design matrix

q.sims <- 10^2  # How many data sets should I simulate?
sim.results <- matrix(,nrow=q.sims,ncol=3)
colnames(sim.results) <- c("beta_1","lower.limit","upper.limit")

set.seed(9409)
for(i in 1:q.sims){
  y <- X%*%beta.truth + rnorm(n,0,sqrt(sigma2.truth)) # Generate data
  m1 <- lm(y~x)
  sim.results[i,1:3] <- c(coef(m1)[2],confint(m1)[2,])
}

# Mean of beta1
mean(sim.results[,1])
## [1] 1.013225# Plot confidence interval library(plotrix) plotCI(c(1:q.sims),sim.results[,1],li=sim.results[,2],ui=sim.results[,3], sfrac=0.005,pch=20,xlab="Simulation data set",ylab=expression(beta[1])) abline(a=beta.truth[2],b=0,col="gold",lwd=3)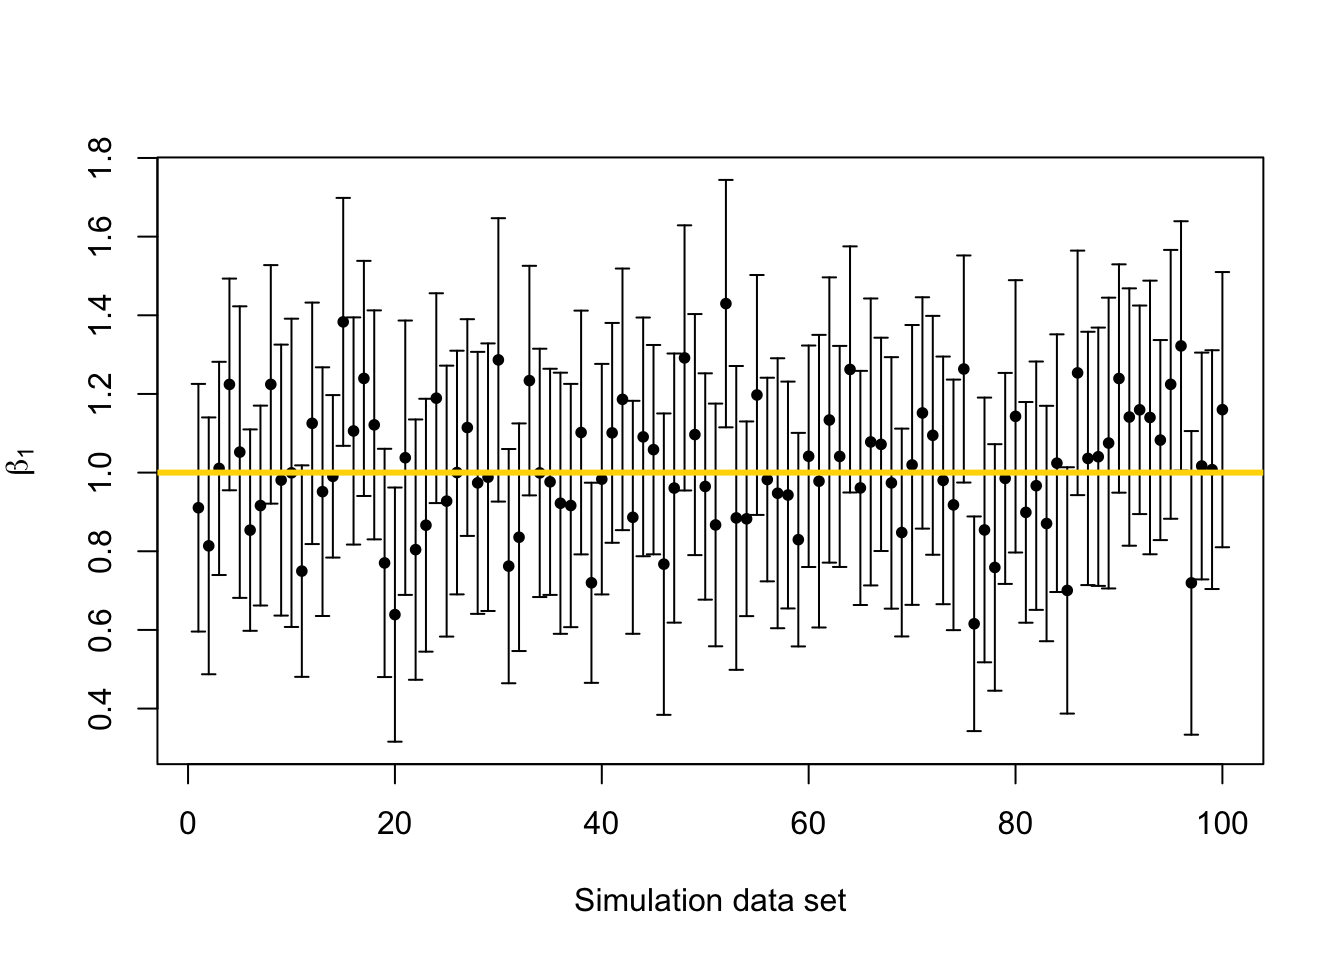
# Calculate the coverage probability
covered <- ifelse(sim.results[,2] < beta.truth[2] & sim.results[,3] > beta.truth[2],1,0)
mean(covered)
## [1] 0.94