Chapter 2 Introduction to statistical inference
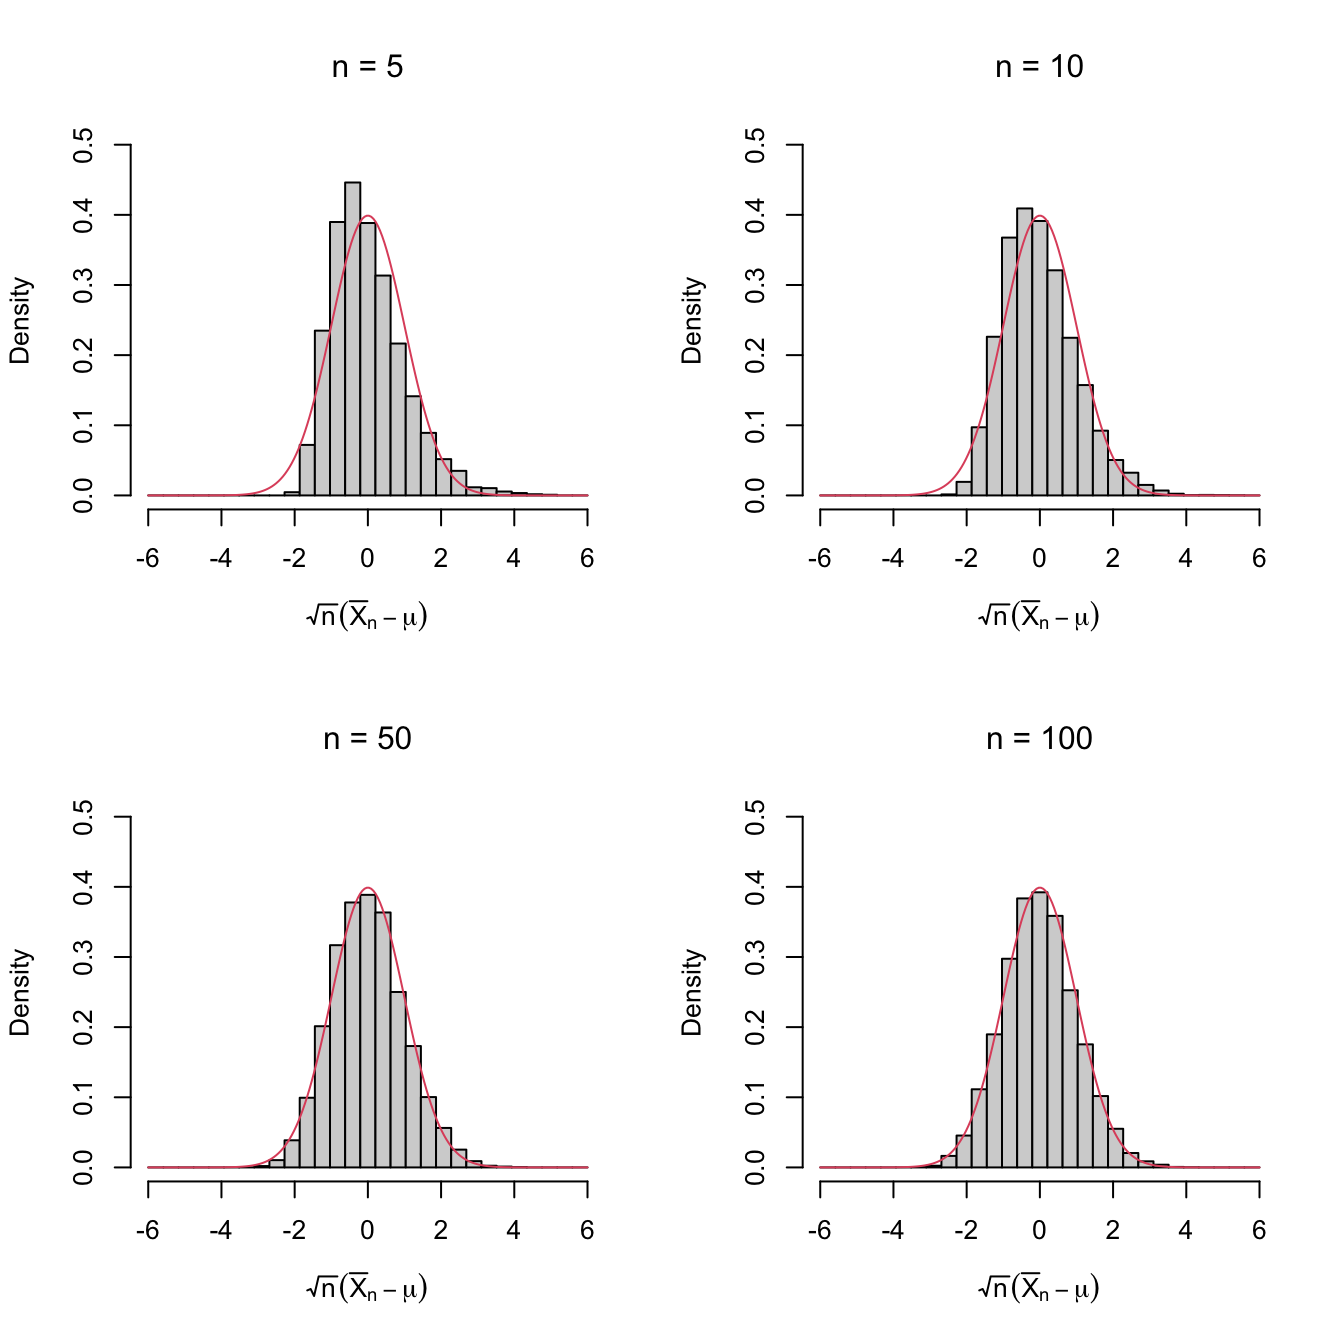
Figure 2.1: Histograms of \(\sqrt{n}(\bar{X}_n-\mu)\) for independent rv’s \(X_1,\ldots,X_n\) with expectation \(\mu\) and variance \(\sigma^2.\) The pdf of \(\mathcal{N}(0,\sigma^2)\) is superimposed in red. A clear convergence appears, despite \(X_1,\ldots,X_n\sim\mathrm{Exp}(1)\) being heavily non-normal. The culprit is the Central Limit Theorem.
This chapter introduces the basic elements in statistical inference and proves the simplest case of the central limit theorem.