Chapter 6 Hypothesis tests
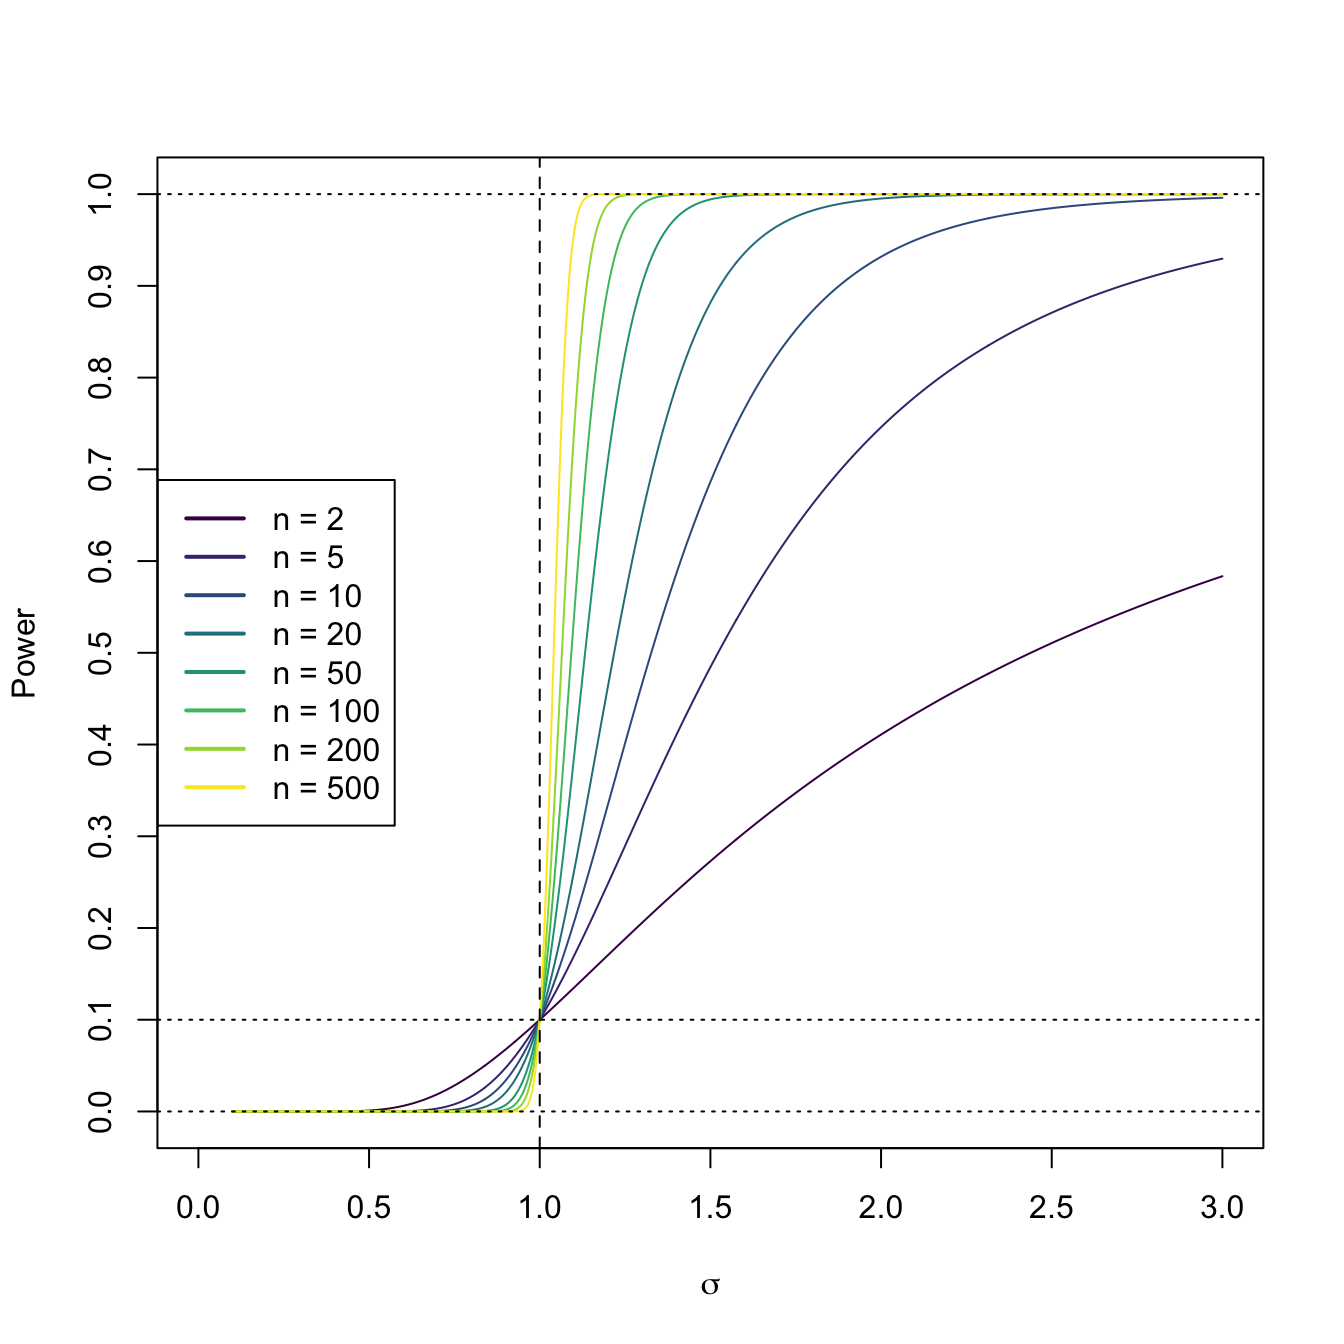
Figure 6.1: Power curve of the one-sided hypothesis test for \(H_0:\sigma^2=\sigma_0^2\) vs. \(H_1:\sigma^2>\sigma_0^2\) in a normal population \(\mathcal{N}(0,\sigma^2).\) The power curve represents the probability of rejecting \(H_0:\sigma^2=\sigma_0^2,\) as a function of \(\sigma,\) from a sample of size \(n\) from \(\mathcal{N}(0,\sigma^2).\) The dashed vertical line is the value of \(\sigma_0=1\) and the dotted horizontal line is the significance level \(\alpha=0.10.\) The power increases as \(n\) increases and as \(\sigma\) increases, as the evidence against \(H_0:\sigma^2=\sigma_0^2\) is stronger in those cases. Observe how a one-sided test has no power when \(\sigma^2<\sigma_0^2,\) since it is designed to “face” \(H_1:\sigma^2>\sigma_0^2\).
Hypothesis tests are arguably the main tool in statistical inference to answer research questions in a precise and formal way that takes into account the uncertainty behind the data generation and measurement process. This chapter introduces the basics of hypothesis testing, the most-known tests for one and two normal populations, and the theory of likelihood ratio tests.