Chapter 65: LaTeX annotation by TikZ
annotated LaTeX formula by TikZ figure

Fig. 17.1: test
annotated LaTeX formula by TikZ figure 2
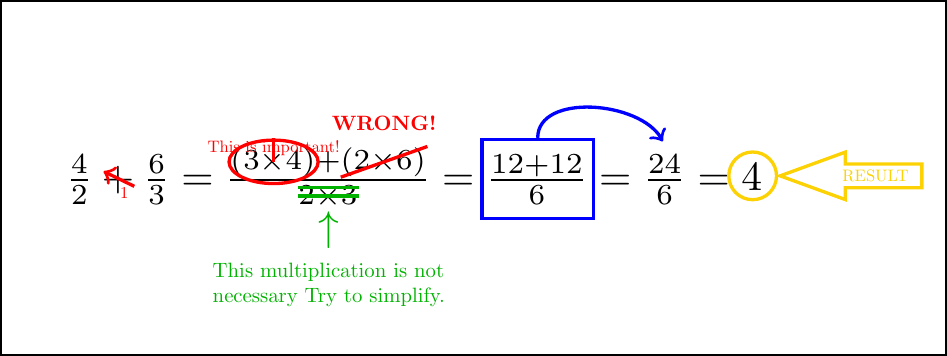
Fig. 17.2: test

Fig. 24.2: test
\begin{tikzpicture}
  \begin{axis}[
        %axis x line = center,
        %axis y line = center,
        %xlabel = {$ x $}, xlabel style = {right},
        %ylabel = {$ y=f\left(x\right) $}, ylabel style = {above},
        xmin = -1, xmax = 1,
        ymin = -0.5, ymax = 0.5,
        %hide obscured x ticks=false, % for origin x tick label i.e. xtick = {0}
        xtick= \empty,
        xticklabels= \empty,
        %extra x ticks={0},
        ytick = \empty,
        yticklabels= \empty,
        x = 5cm, y = 5cm, % x y scaling
        %grid = major,
        domain = -1:1,
        %samples = 1000
    ]
    \node at (axis cs: 0,0) {
      $\begin{aligned}
      f\left(x\right)= & x^{x}\\
      \ln f\left(x\right)= & x\ln x\\
      \dfrac{\mathrm{d}}{\mathrm{d}x}\ln f\left(x\right)= & \dfrac{\mathrm{d}}{\mathrm{d}x}\left[x\ln x\right]\\
      \dfrac{f^{\prime}\left(x\right)}{f\left(x\right)}= & \left[x\ln x\right]^{\prime}\\
      f^{\prime}\left(x\right)= & f\left(x\right)\left[x\ln x\right]^{\prime}=x^{x}\left[\left(x\right)^{\prime}\ln x+x\left(\ln x\right)^{\prime}\right]\\
      = & x^{x}\left[1\ln x+x\dfrac{1}{x}\right]=x^{x}\left[\ln x+1\right]=x^{x}\left[1+\ln x\right]\\
      = & x^{x}+x^{x}\ln x
      \end{aligned}$
      };
  \end{axis}
\end{tikzpicture}
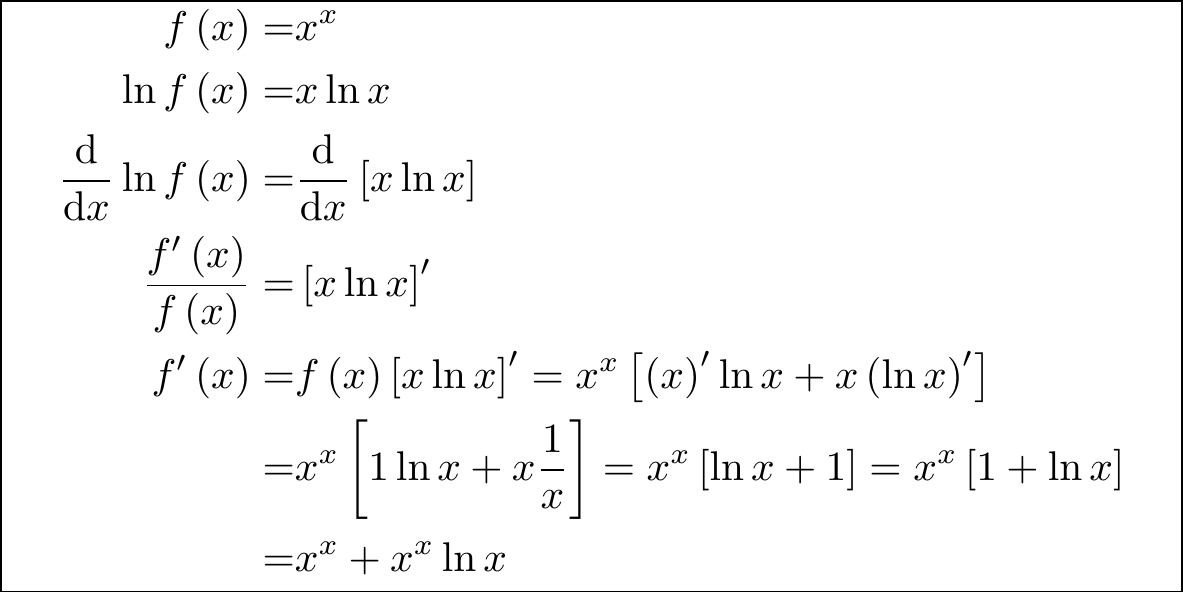
Fig. 16.2: test
https://tex.stackexchange.com/questions/670153/how-to-annotate-calculations

Fig. 24.3: test
\begin{tikzpicture}
  \begin{axis}[
        %axis x line = center,
        %axis y line = center,
        %xlabel = {$ x $}, xlabel style = {right},
        %ylabel = {$ y=f\left(x\right) $}, ylabel style = {above},
        xmin = -0.7, xmax = 0.9,
        ymin = -0.3, ymax = 0.3,
        %hide obscured x ticks=false, % for origin x tick label i.e. xtick = {0}
        xtick= \empty,
        xticklabels= \empty,
        %extra x ticks={0},
        ytick = \empty,
        yticklabels= \empty,
        x = 5cm, y = 5cm, % x y scaling
        %grid = major,
        domain = -1:1,
        %samples = 1000
    ]
    \node at (axis cs:0,0) {
      $\tikzmarknode{a1}{\frac{4}{2}}+\tikzmarknode{a2}{\frac{6}{3}}=
      \frac{\tikzmarknode{b1}{(3\times 4)}+\tikzmarknode{b2}{(2\times 6)}}{\tikzmarknode{b3}{2\times 3}}=\tikzmarknode{c1}{\frac{12+12}{6}}=\tikzmarknode{c2}{\frac{24}{6}}=\tikzmarknode{d1}{4}$};

    \draw[red, thick, ->, shorten <=1em, , shorten >=1em](a2.south east)--node[below, pos=.45, scale=.4]{1}(a1.north west);
    \node[draw=red, thick, ellipse, fit=(b1), inner ysep=0, inner xsep=-1mm](ell){};
    \draw[thick, red] (ell)--++(0,.5)node[above, red, scale=.4]{This is important!};
    \draw[red, thick] (b2.south west)--node[above=2mm, red, scale=.5]{\bfseries WRONG!}(b2.north east);
    \draw[green!70!black, thick] (b3.east)--node[below]{$\uparrow$}node[below=5mm, align=left, green!70!black, scale=.5]{This multiplication is not\\necessary Try to simplify.}(b3.west) ([yshift=2pt]b3.east)--([yshift=2pt]b3.west);
    \node[draw=blue, thick, fit=(c1), inner xsep=1pt](box){};
    \draw[blue, thick, ->, shorten >=3pt] (box) to[out=90, in=90] (c2.north);
    \node[draw=yellow!70!orange, thick, circle, fit=(d1), inner sep=1pt](cir){};
    \node[draw=yellow!70!orange, thick, text=yellow!70!orange, single arrow, shape border rotate=180, anchor=west, scale=.4, single arrow tip angle=40, minimum height=30mm] at (cir.east){\quad RESULT};
  \end{axis}
\end{tikzpicture}

Fig. 48.1: test
https://tex.stackexchange.com/questions/494884/anchor-alignment-in-tikzmarknode
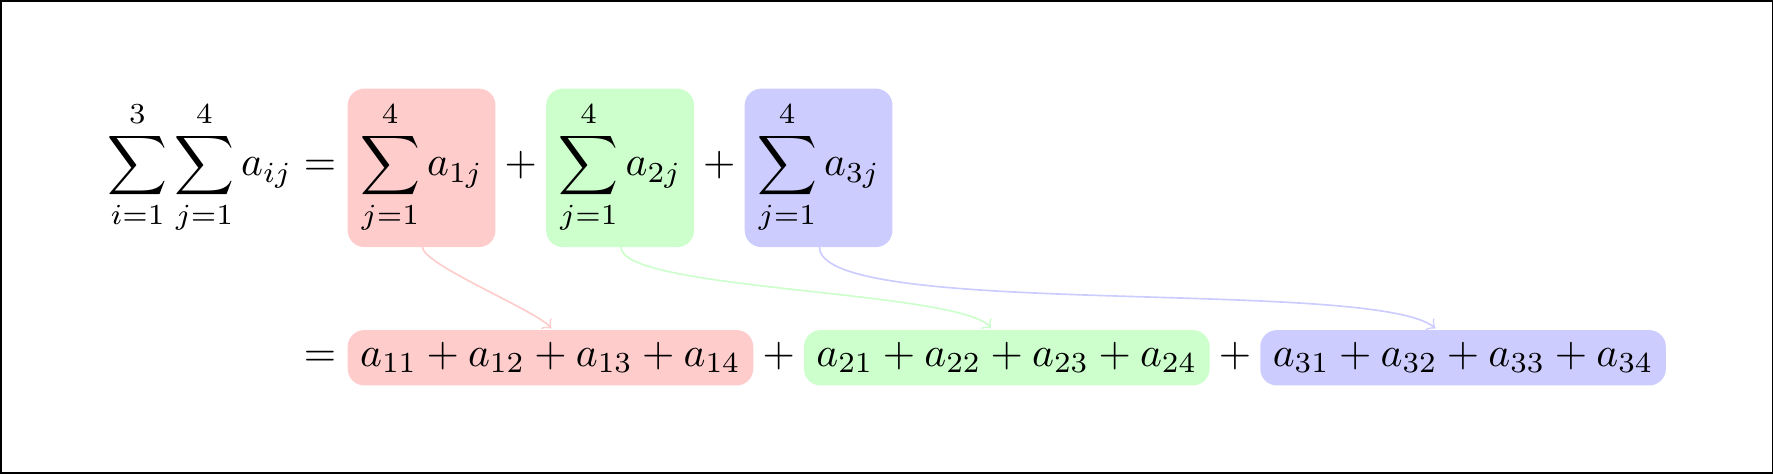
Fig. 48.2: test
\tikzset{every tikzmarknode/.append style={inner sep=3pt,rounded
corners}}

\begin{tikzpicture}
  \begin{axis}[
        %axis x line = center,
        %axis y line = center,
        %xlabel = {$ x $}, xlabel style = {right},
        %ylabel = {$ y=f\left(x\right) $}, ylabel style = {above},
        xmin = -1.5, xmax = 1.5,
        ymin = -0.4, ymax = 0.4,
        %hide obscured x ticks=false, % for origin x tick label i.e. xtick = {0}
        xtick= \empty,
        xticklabels= \empty,
        %extra x ticks={0},
        ytick = \empty,
        yticklabels= \empty,
        x = 5cm, y = 5cm, % x y scaling
        %grid = major,
        domain = -1:1,
        %samples = 1000
    ]
    \node at (axis cs: 0,0) {
      $\begin{aligned}
  \sum\limits_{i=1}^{3}\sum\limits_{j=1}^{4} a_{ij}&=
  \tikzmarknode[fill=red!20]{red1}{\sum\limits_{j=1}^{4}a_{1j}} +
  \tikzmarknode[fill=green!20]{green1}{\sum\limits_{j=1}^{4}a_{2j}} +
  \tikzmarknode[fill=blue!20]{blue1}{\sum\limits_{j=1}^{4}a_{3j}}\\
  \\
  &=
  \tikzmarknode[fill=red!20]{red2}{a_{11} + a_{12} + a_{13} + a_{14}} +
  \tikzmarknode[fill=green!20]{green2}{a_{21} + a_{22} + a_{23} + a_{24}} +
  \tikzmarknode[fill=blue!20]{blue2}{a_{31} + a_{32} + a_{33} + a_{34}}
\end{aligned}$
      };
    \draw[->,red!20] (red1.south) to[out=-90,in=120,looseness=0.3] (red2.north);
    \draw[->,green!20] (green1) to[out=-90,in=120,looseness=0.3] (green2);
    \draw[->,blue!20] (blue1) to[out=-90,in=135,looseness=0.3] (blue2);
  \end{axis}
\end{tikzpicture}

Fig. 48.4: test
https://zhuanlan.zhihu.com/p/694787336
LaTeX macro: annotate-equations
\usepackage{annotate-equations}
https://github.com/synercys/annotated_latex_equations
https://github.com/synercys/annotated_latex_equations/blob/main/example_prob.tex