Noel 2012
Excerpt from published methods
… we used BMI derived from heights and weights obtained during routine clinical encounters. These data are stored in facility information systems and uploaded into the Corporate Data Warehouse; validation work indicates that some of these height and weight values probably reflect data entry errors. Therefore, we used an iterative process to eliminate or control for height and weight outliers while avoiding suspect BMI values. In specifying the original cohort of obese primary care patients, we removed biologically “implausible” values (i.e., weights $$70 lbs or $$700 lbs and heights $$48 inches or $$84 inches). We then divided each of the five study years into quarters and determined the median value for weights recorded during each quarter for every patient, yielding up to 20 quarterly median weights.
Translation in Pseudocode
DEFINE weight_ij for person i IN 1:I and weight j @ time t
Divide time vector into q Fiscal Quarters
FOR i IN 1:I
    FOR j IN 1:J
        IF (weight_ij > 70 lbs. & weight_ij < 700 lbs.)
            weight_ij := weight @ t_ij
    END FOR
    FOR q IN 1:Q
        weight_iq := MEDIAN({weight_i}_j) (all weights within quarter q)
    END FOR
END FOR
This algorithm is very similar to Jackson et al. 2015, where the windows are defined by fiscal quarters. If you knew the exact beginning and end dates of the Fiscal quarters you would like to use, you could use Jackson2015.f, to get something similar. Here I will build the algorithm to handle any Fiscal years and let the function/algorithm convert to fiscal quarters automatically.
Algorithm in R Code
#' @title Noel 2012 Measurment Cleaning Algorithm
#' @param DF object of class `data.frame`, containing `id` and `measures`
#' @param id string corresponding to the name of the column of patient identifiers in `DF`
#' @param measures string corresponding to the name of the column of measurements in `DF`
#' @param tmeasures string corresponding to the name of the column of measurement collection dates or times in `DF`. If `tmeasures` is a date object, there may be more than one weight on the same day, if it precise datetime object, there may not be more than one weight on the same day
#' @param outliers object of type `list` with numeric inputs corresponding to the upper and lower bound for each time entry. Default is `list(LB = 70, UB = 700)`
#' @param fiscal_start integer to be passed to `lubridate::quarter()`. Defaults to 10, indicating October, the Federal Fiscal Year starting month.
#TODO: add @param collapse = FALSE - aggregate to Fiscal Quarter? Default is FALSE, returning `DF` appended with `Qmedian` to be collapsed after calling the function.
Noel2012.f <- function(DF,
                       id,
                       measures,
                       tmeasures,
                       outliers = c(70, 700),
                       fiscal_start = 10) {

  if (!require(dplyr))      install.packages("dplyr")
  if (!require(data.table)) install.packages("data.table")

  tryCatch(
    if (!is.numeric(DF[[measures]])) {
      stop(
        print("measure data must be a numeric vector")
      )
    }
  )

  tryCatch(
    if (!is.numeric(outliers)) {
      stop(
        print("outliers must be numeric")
      )
    }
  )

  # convert to data.table
  DT <- data.table::as.data.table(DF)

  # Step 1: Set outliers to NA
  DT[,
     output := ifelse(get(measures) < outliers[1]
                      | get(measures) > outliers[2],
                      NA,
                      get(measures))
     ]

  # Step 2: Set Fiscal Years and Quarters
  DT[,
     FYQ := lubridate::quarter(get(tmeasures),
                               with_year = TRUE,
                               fiscal_start = fiscal_start)
     ]

  # Step 3: aggregate median weight by ID, Fiscal Year and Quarter
  key_cols <- c(id, "FYQ")
  setkeyv(DT, key_cols)
  DT[, `:=` (Qmedian = median(output, na.rm = TRUE)), keyby = key_cols]
  DT
}
Algorithm in SAS Code
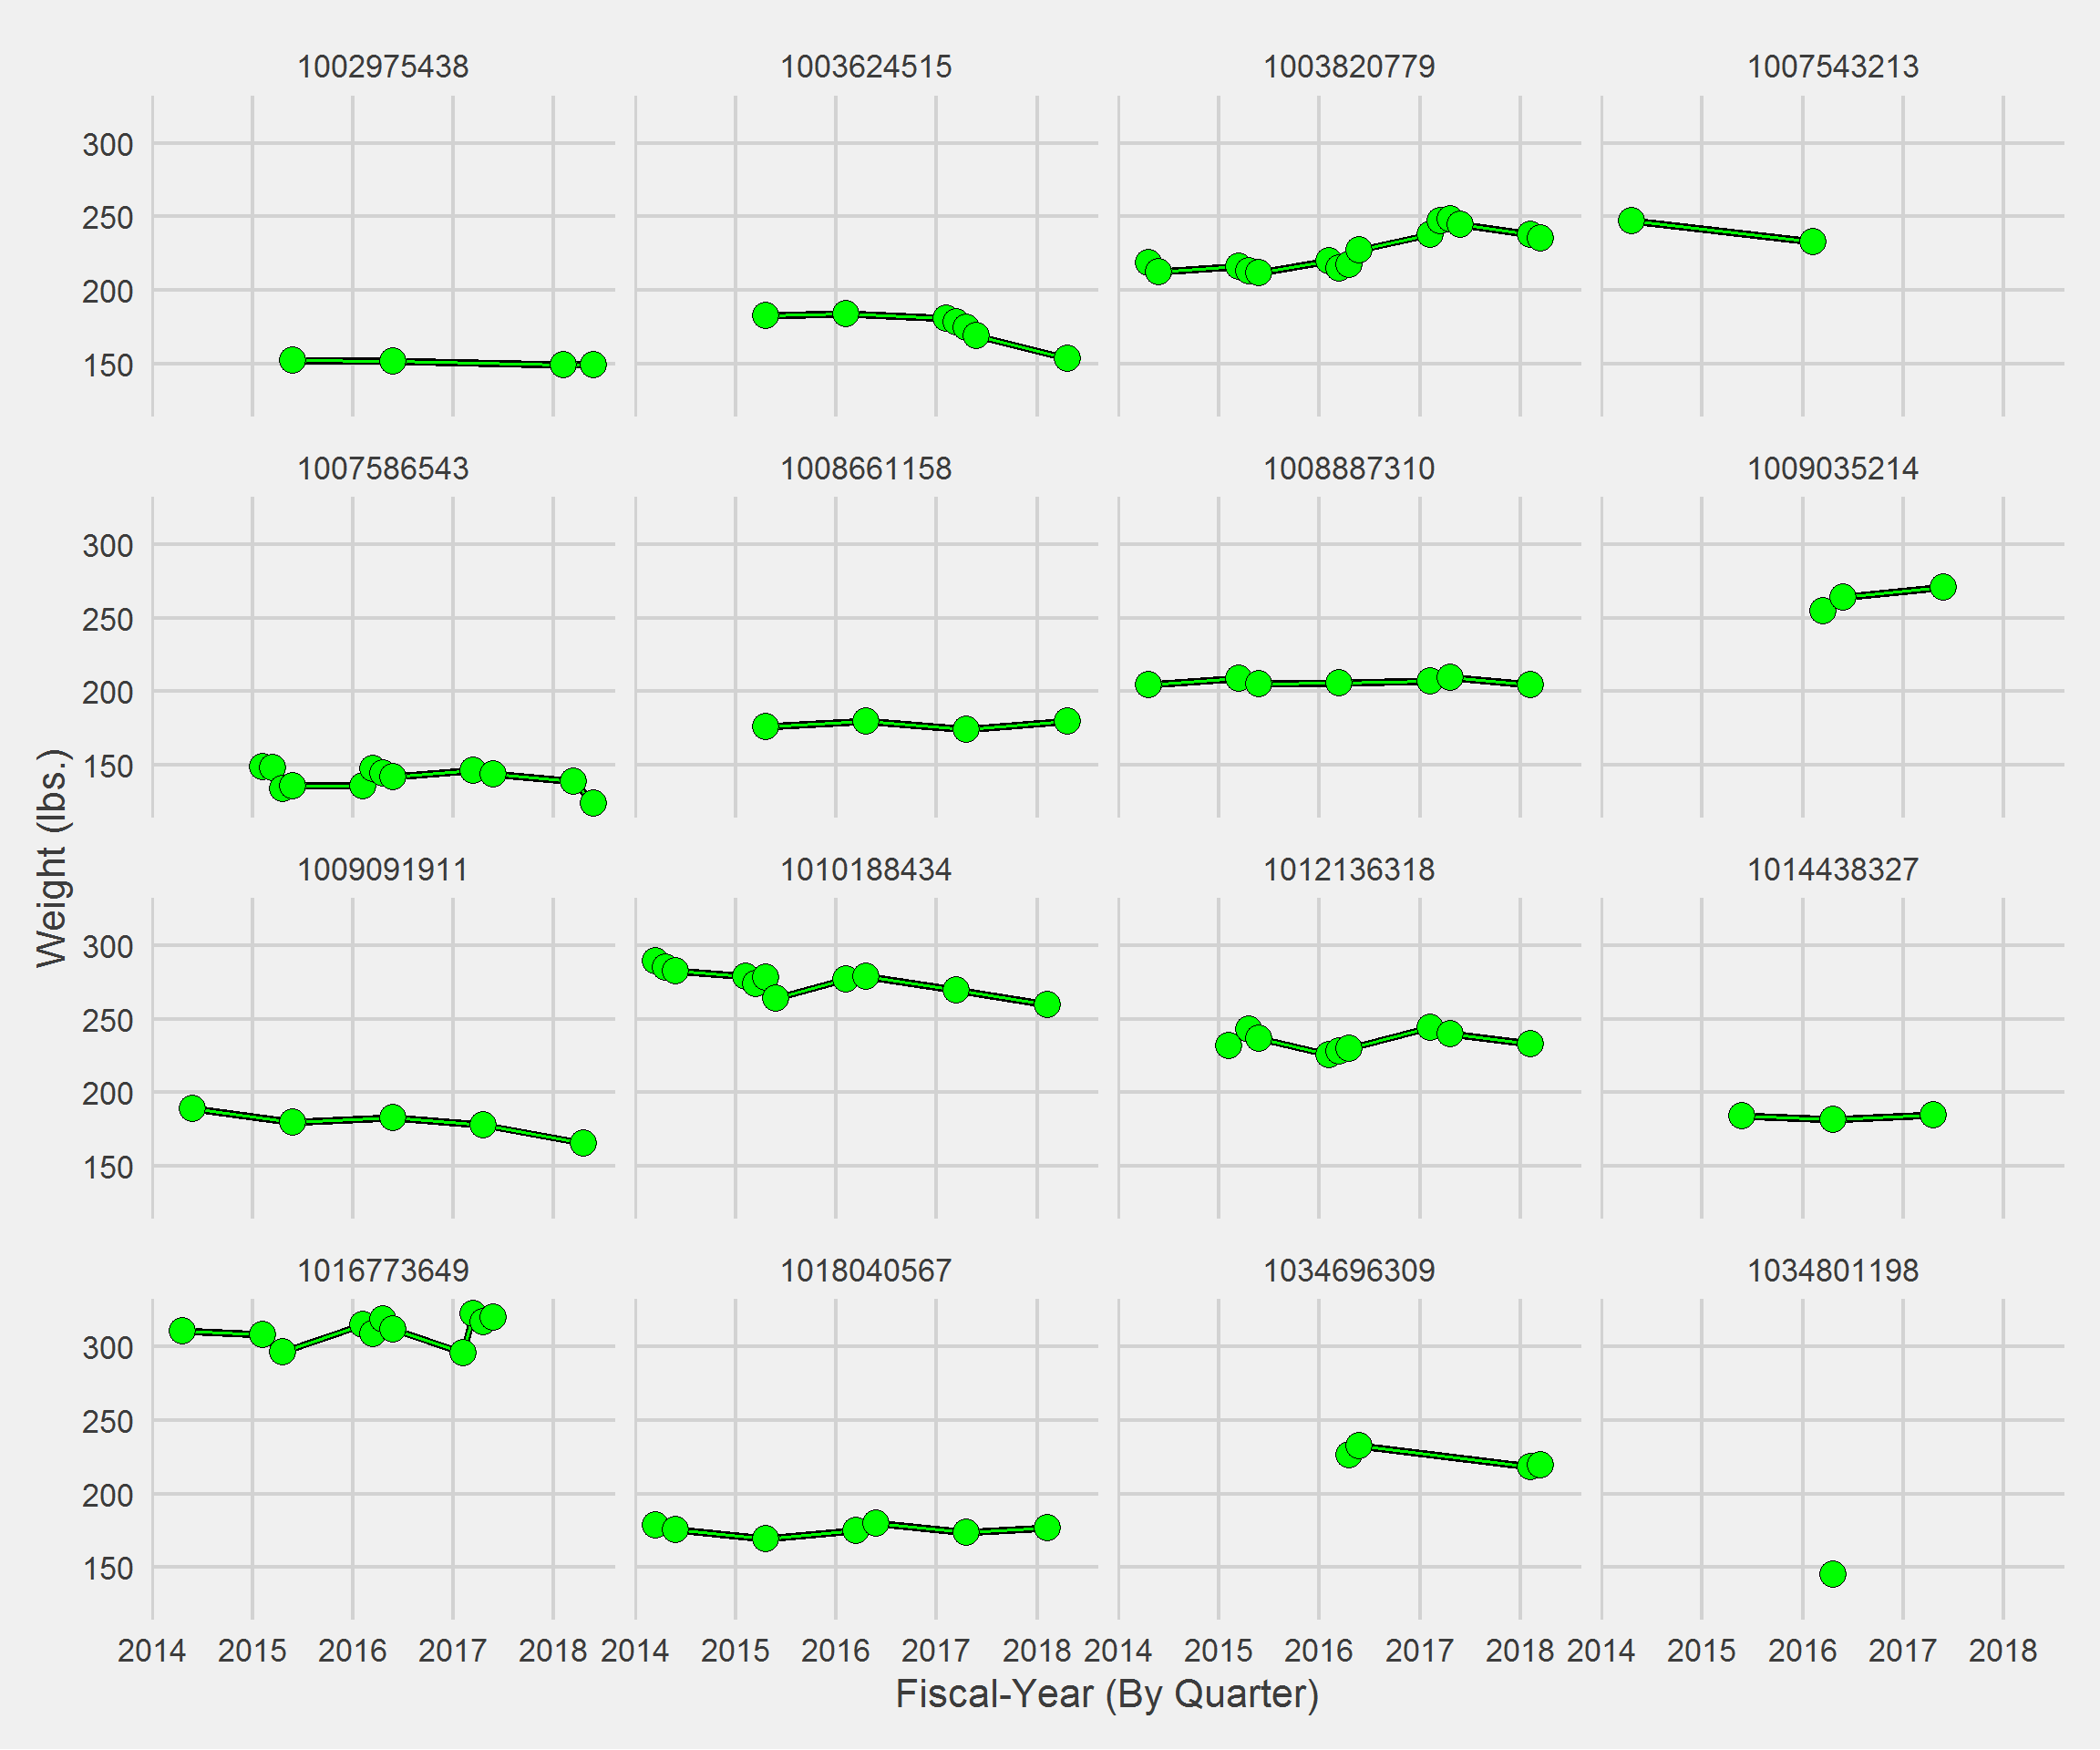
Example in R
Displaying a Vignette of 16 selected patients.
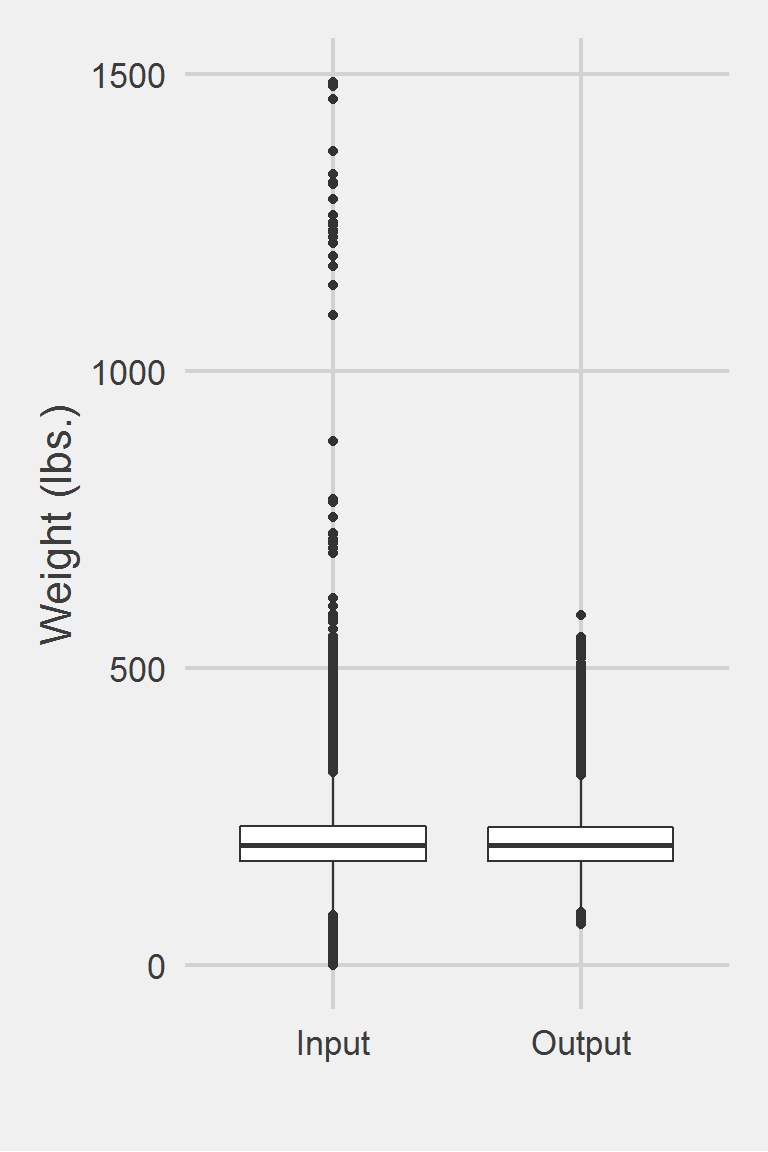
Distribution of Weight Measurements between Raw and Algorithm-Processed Values
 Descriptive statistics by group
group: Input
   vars       n   mean   sd median trimmed   mad min    max  range skew
X1    1 1175995 207.82 48.6  202.3  204.62 44.18   0 1486.2 1486.2 0.98
   kurtosis   se
X1      5.6 0.04
------------------------------------------------------------
group: Output
   vars      n   mean    sd median trimmed   mad min   max range skew kurtosis
X1    1 683008 207.25 46.13    202  204.22 42.25  70 588.9 518.9  0.8     1.44
     se
X1 0.06
Left boxplot is raw data from 2008, PCP visit subjects while the right boxplot describes the output from running Noel2012.f()