Janney 2016
Excerpt from published methods
Baseline, 6- and 12-mo body weight measures were retrieved for each MOVE! veteran from the VHA patient care databases. Baseline weight was measured within 30 d of MOVE! enrollment. The closest weight within a 60-d window of the follow-up target date (180 d for 6 mo and 365 d for 12 mo) was selected/defined as weight for 6- and 12-mo follow-ups. Weight was coded missing if not available at baseline, 6 mo, and/or 12 mo. Outliers were defined as baseline weight less than 91 lb or greater than 600 lb; 6- or 12-mo weight less than 72 lb or greater than 650 lb; weight change from baseline greater than 100 lb …
Translation in pseudocode
DEFINE time t_ij for person i IN 1:I, j weights IN 1:J {0mo., 6mo., 12mo.}
FOR i IN 1:I
    weight_i1 := weight @ t_i1 +/- 30 days (baseline)
    IF (weight_i1 < 91 lbs. OR weight_i1 > 600 lbs.)
        weight_i1 := NA
    FOR j IN 2:J
        weight_ij := weight @ t_ij +/- 60 days
        IF (weight_ij < 72 lbs. OR weight_ij > 650 lbs.)
            weight_ij := NA
    END FOR
END FOR
Algorithm in R Code
Though the Pseudocode is written with for loops, this is not a proper R programming technique since it’s very slow, especially given the amount of data this project involves. There are ways to speed up our code but we can try those options later.
#-------------------------------- set windows --------------------------------#

#' @title Windows.f Measurment Cleaning Algorithm
#' @param DF object of class `data.frame`, containing `id` and `measures`
#' @param id string corresponding to the name of the column of patient identifiers in `df`
#' @param measures string corresponding to the name of the column of measures in `df`, e.g., numeric weight data if using to clean weight data.
#' @param tmeasures string corresponding to the name of the column of measure dates and/or times in `df`
#' @param startPoint string corresponding to the name of the column in `df` holding the time at which subsequent measurement dates will be assessed, should be the same for each person. Eg., if t = 0 (t[1]) corresponds to an index visit held by the variable 'VisitDate', then `startPoint` should be set to 'VisitDate'
#' @param t numeric vector of time points to collect measurements, eg. `c(0, 182.5, 365)` for measure collection at t = 0, t = 180 (6 months from t = 0), and t = 365 (1 year from t = 0). Default is `c(0, 182.5, 365)` according to Janney et al. 2016
#' @param windows numeric vector of measurement collection windows to use around each time point in t. Eg. Janney et al. 2016 use `c(30, 60, 60)` for t of `c(0, 182.5, 365)`, implying that the closest measurement t = 0 will be collected 30 days prior to and 30 days post startPoint. Subsequent measurements will be collected 60 days prior to and 60 days post t0+182.5 days, and t0+365 days.
windows.f <- function(DF,
                      id,
                      measures,
                      tmeasures,
                      startPoint,
                      t = c(0, 182, 365),
                      windows = c(30, 60, 60)) {

  if (!require(dplyr))      install.packages("dplyr")
  if (!require(data.table)) install.packages("data.table")
  if (!require(rlang))      install.packages("rlang")

  tryCatch(
    if (class(DF[[tmeasures]])[1] != class(DF[[startPoint]])[1]) {
      stop(
            print(
                  paste0("date type of tmeasures (",
                  class(DF[[tmeasures]]),
                  ") != date type of startPoint (",
                  class(DF[[startPoint]])[1],
                  ")"
                 )
          )
      )
    }
  )

  tryCatch(
    if (class(t) != "numeric") {
      stop(
        print("t parameter must be a numeric vector")
      )
    }
  )

  tryCatch(
    if (class(windows) != "numeric") {
      stop(
        print("windows parameter must be a numeric vector")
      )
    }
  )

  tmeasures  <- rlang::sym(tmeasures)
  startPoint <- rlang::sym(startPoint)

  DF <- DF %>%
    mutate(
      time = as.numeric(
        difftime(
          !!tmeasures, !!startPoint,
          tz = "utc", units = "days"
        )
      )
    )

  # convert to data.table
  DT <- data.table::as.data.table(DF)
  setkeyv(DT, id)

  # loop through each time point in `t`, place into list
  meas_tn <- vector("list", length(t)) # set empty list
  for (i in 1:length(t)) {
    # find measurement closest to t[i]
    x <- DT[DT[, .I[abs(t[i] - time) == min(abs(t[i] - time))],
            by = eval(id)]$V1]
    # apply time outlier window/filter
    x <- x[time >= (t[i] - windows[i]) & time <= (t[i] + windows[i]), ]

    # reconcile duplicates
    x <- x[x[, .I[1], by = eval(id)]$V1] # take the first

    # tidy up
    meas_tn[[i]] <- x %>%
      as.data.frame() %>%
      mutate(measureTime = paste0("t_", t[i]))
  }

  id <- rlang::sym(id)

  # return result
  do.call(rbind, meas_tn) %>%
    arrange(!!id, !!tmeasures)
}

#------------------------------ Remove Outliers ------------------------------#

#' @title outliers.f Measurment Cleaning Algorithm - removing outliers. To be applied following the result of a call to windows.f()
#' @param DF object of class data.frame, containing id and weights
#' @param measures string corresponding to the name of the column of measures in df, e.g., numeric weight data if using to clean weight data.
#' @param t numeric vector of time points to collect measurements, eg. c(0, 182.5, 365) for measure collection at t = 0, t = 180 (6 months from t = 0), and t = 365 (1 year from t = 0). Default is c(0, 182.5, 365) according to Janney et al. 2016
#' @param outliers object of type list with numeric inputs corresponding to the upper and lower bound for each time entry in parameter `t`. Default is list(LB = c(91, 72, 72), UB = c(600, 650, 650)) for t = c(0, 182.56, 365), differing between baseline and subsequent measurement collection dates
outliers.f <- function(DF,
                       measures,
                       t = c(0, 182.5, 365),
                       outliers = list(LB = c(91, 72, 72),
                                       UB = c(600, 650, 650))) {

  if (!require(dplyr))      install.packages("dplyr")
  if (!require(data.table)) install.packages("data.table")

  tryCatch(
    if (class(DF[[measures]]) != "numeric") {
      stop(
        print("weight data must be a numeric vector")
      )
    }
  )

  tryCatch(
    if (class(outliers) != "list" & !is.null(outliers)) {
      stop(
        print("outliers must be placed into a list object")
      )
    }
  )

  bounds.df <- data.frame(
    t = paste0("t_", t),
    LB = outliers[[1]],
    UB = outliers[[2]],
    stringsAsFactors = FALSE
  )

  a <- rlang::sym(measures)
  meas_updated <- rlang::quo_name(paste0(measures, "_OR"))

  DF <- DF %>%
    left_join(bounds.df, by = c("measureTime" = "t")) %>%
    mutate(!!meas_updated := ifelse(!!a < LB | !!a > UB, NA, !!a))

  DF
}

#------------------------- Windows + Outlier Removal -------------------------#

#' @title Janney2016.f Weight Measurment Cleaning Algorithm
#' @param DF object of class data.frame, containing id and weights
#' @param id string corresponding to the name of the column of patient IDs in `DF`
#' @param measures string corresponding to the name of the column of measures in `DF`, e.g., numeric weight data if using to clean weight data
#' @param tmeasures string corresponding to the name of the column of measure dates and/or times in `DF`
#' @param startPoint string corresponding to the name of the column in `DF` holding the time at which subsequent measurement dates will be assessed, should be the same for each person. Eg., if t = 0 (t[1]) corresponds to an index visit held by the variable 'VisitDate', then startPoint should be set to 'VisitDate'
#' @param t numeric vector of time points to collect measurements, eg. c(0, 182.5, 365) for measure collection at t = 0, t = 180 (6 months from t = 0), and t = 365 (1 year from t = 0). Default is c(0, 182.5, 365) according to Janney et al. 2016
#' @param windows numeric vector of measurement collection windows to use around each time point in t. Eg. Janney et al. 2016 use c(30, 60, 60) for t of c(0, 182.5, 365), implying that the closest measurement t = 0 will be collected 30 days prior to and 30 days post startPoint. Subsequent measurements will be collected 60 days prior to and 60 days post t0+182.5 days, and t0+365 days
#' @param outliers optional. object of type list with numeric inputs corresponding to the upper and lower bound for each time entry in parameter `t`. Default is list(LB = c(91, 72, 72), UB = c(600, 650, 650)) for t = c(0, 182.56, 365), differing between baseline and subsequent measurment collection dates. If not specified then only the subsetting and window functions will be applied.
Janney2016.f <- function(DF,
                         id,
                         measures,
                         tmeasures,
                         startPoint,
                         t = c(0, 182.5, 365),
                         windows = c(30, 60, 60),
                         outliers = list(LB = c(91, 72, 72),
                                          UB = c(600, 650, 650))) {

  windowsApplied.df <- windows.f(DF = DF,
                                 id = id,
                                 measures = measures,
                                 tmeasures = tmeasures,
                                 startPoint = startPoint,
                                 t = t,
                                 windows = windows)

  outliersRemoved.df <- outliers.f(DF = windowsApplied.df,
                                   measures = measures,
                                   t = t,
                                   outliers = outliers)
  # return fully cleaned data
  outliersRemoved.df
}
Algorithm in SAS Code
/******************************** Set Windows *******************************/

/*
title: Windows: Weight Measurment Cleaning Algorithm;
param: df: table containing id and weights;
param: id: string corresponding to the name of the column of patient IDs in df
param: measures: string corresponding to the name of the column of measures in
         df, e.g., numeric weight data if using to clean weight data.
param: tmeasures: string corresponding to the name of the column of measure
         dates and/or times in df
param: startPoint: string corresponding to the name of the column in df holding
       the time at which subsequent measurement dates will be assessed,
       should be the same for each person. Eg., if t = 0 corresponds
       to an index visit held by the variable 'VisitDate', then
         startPoint should be set to 'VisitDate'
param: TWindows: table with time points to collect data and windows
         around each window.
         Columns should be:
         column: t: numeric vector of time points to collect measurements,
                        e.g., c(0, 182.5, 365) for measure collection at t = 0,
                        t = 180 (6 months from t = 0), and t = 365
                          (1 year from t = 0). Default is c(0, 182.5, 365) according
                        to Janney et al. 2016
         column: windows: numeric vector of measurement collection windows to use
                         around each time point in t. E.g., Janney et al. 2016
                         use (30, 60, 60) for t of (0, 182.5, 365), implying
                       that the closest measurement t = 0 will be collected
                       30 days prior to and 30 days post startPoint.
                         Subsequent measurements will be collected 60 days prior
                         to and 60 days post t0 + 182.5 days, and t0 + 365 days
*/

%MACRO windows(df = ,
                     id = ,
                     measures = ,
                   tmeasures = ,
                     startpoint = ,
                     TWindows = );

    DATA dt;
        SET &df;
            time = (&tmeasures - &startPoint) / 86400;
    RUN;

    PROC SQL NOPRINT;

        SELECT t INTO :timePoints SEPARATED BY ' '
            FROM TWindows;

        CREATE TABLE t1 AS
            SELECT a.*,
                   b.windows,
                   %scan(&timePoints, 1, ' ') AS t FORMAT BEST.
                FROM dt AS a, (
                               SELECT *
                                 FROM TWindows
                                 WHERE t = %scan(&timePoints, 1, ' ')
                              ) AS b
                    GROUP BY &id
                    HAVING ABS(b.t - a.time) eq MIN(ABS(b.t - a.time))
                    ORDER BY &id, &tmeasures;

        CREATE TABLE t2 AS
            SELECT a.*,
                   b.windows,
                   %scan(&timePoints, 2, ' ') AS t FORMAT BEST.
                FROM dt AS a, (
                               SELECT *
                                 FROM TWindows
                                 WHERE t = %scan(&timePoints, 2, ' ')
                              ) AS b
                    GROUP BY &id
                    HAVING ABS(b.t - a.time) eq MIN(ABS(b.t - a.time))
                    ORDER BY &id, &tmeasures;

        CREATE TABLE t3 AS
            SELECT a.*,
                   b.windows,
                   %scan(&timePoints, 3, ' ') AS t FORMAT BEST.
                FROM dt AS a, (
                               SELECT *
                                 FROM TWindows
                                 WHERE t = %scan(&timePoints, 3, ' ')
                              ) AS b
                    GROUP BY &id
                    HAVING ABS(b.t - a.time) eq MIN(ABS(b.t - a.time))
                    ORDER BY &id, &tmeasures;
    QUIT;

    DATA WindowsSet;
        SET t1 t2 t3;
            IF time >= (t - windows) AND time <= (time + windows);
    RUN;

    PROC SORT DATA = WindowsSet; by PatientICN t; RUN;

    PROC DATASETS nolist; DELETE T1 T2 T3 Dt; QUIT;

%MEND windows;

/****************************** Remove Outliers *****************************/

/*
title: Outliers: Measurment Cleaning Algorithm - to be applied following a call
         to %WINDOWS
param: df: table containing id and weights
param: measures: string corresponding to the name of the column of measures in
         df, e.g., numeric weight data if using to clean weight data.
param: TOutliers: table with time points to collect data and outliers for each
         time point.
         Columns should be:
         column: t: numeric vector of time points to collect measurements,
                        e.g., c(0, 182.5, 365) for measure collection at t = 0,
                        t = 180 (6 months from t = 0), and t = 365
                          (1 year from t = 0). Default is c(0, 182.5, 365) according
                        to Janney et al. 2016
         column: windows: numeric vector of measurement collection windows to use
                           around each time point in t. E.g., Janney et al. 2016
                           use (30, 60, 60) for t of (0, 182.5, 365), implying
                         that the closest measurement t = 0 will be collected
                         30 days prior to and 30 days post startPoint.
                           Subsequent measurements will be collected 60 days prior
                           to and 60 days post t0 + 182.5 days, and t0 + 365 days
       column: upper: upper bound of plausible measurements, one for each time
                       point t.
       column: lower: lower bound of plausible measurements.
*/

%MACRO outliers(df = , measures = , TOutliers = );
    PROC SQL;
        CREATE TABLE OutliersRemoved AS
            SELECT a.*, b.lower, b.upper
                FROM &df AS a JOIN &TOutliers AS b
                    ON a.t = b.t
                WHERE &measures >= lower AND &measures <= upper;
    QUIT;
%MEND outliers;

/*********************** Set Windows + Remove Outliers **********************/

/*
title: Janney2016 Weight Measurment Cleaning Algorithm;
param: df: table containing id and weights;
param: id: string corresponding to the name of the column of patient IDs in df
param: measures: string corresponding to the name of the column of measures in
         df, e.g., numeric weight data if using to clean weight data.
param: tmeasures: string corresponding to the name of the column of measure
         dates and/or times in df
param: startPoint: string corresponding to the name of the column in df holding
         the time at which subsequent measurement dates will be assessed,
         should be the same for each person. Eg., if t = 0 corresponds
         to an index visit held by the variable 'VisitDate', then
         startPoint should be set to 'VisitDate'
param: table: table with time points to collect data, windows around each time
                  point, and lower and upper bounds for outliers at each time.
         Columns should be:
         column: t: numeric vector of time points to collect measurements,
                        e.g., c(0, 182.5, 365) for measure collection at t = 0,
                        t = 180 (6 months from t = 0), and t = 365
                          (1 year from t = 0). Default is c(0, 182.5, 365) according
                        to Janney et al. 2016
         column: windows: numeric vector of measurement collection windows to use
                           around each time point in t. E.g., Janney et al. 2016
                           use (30, 60, 60) for t of (0, 182.5, 365), implying
                         that the closest measurement t = 0 will be collected
                         30 days prior to and 30 days post startPoint.
                           Subsequent measurements will be collected 60 days prior
                           to and 60 days post t0 + 182.5 days, and t0 + 365 days
         column: upper: upper bound of plausible measurements, one for each time
                         point t.
         column: lower: lower bound of plausible measurements.
*/

%MACRO Janney2016(df = ,
                          id = ,
                            measures = ,
                            tmeasures = ,
                            startPoint = ,
                            table = );

    %windows(df = &df.,
                 id = &id.,
                 measures = &measures.,
                 tmeasures = &tmeasures.,
                 startPoint = &startPoint.,
                 TWindows = &table.);

    %outliers(df = WindowsSet,
                  measures = &measures.,
                  TOutliers = &table.);

%MEND WindowCleaner;
Example in R
The way I designed this algorithm allows for multiple time points and windows and thus, includes as special cases,
- Baker et al. 2015
- Braun et al. 2016
- Janney et al. 2016
- Garvin et al. 2015
- Garvin, Marion 2015
- Garvin, Hardy 2013
- Grabarczyk et al. 2017
- Huizinga et al 2010
- Kahwati et al. 2011
- Romanova et al. 2013
- Xiao et al. 2017
Each of these differing either in their outlier bounds or selection of time points:
| Algorithm/Publication | Time Points | Windows | Outliers |
|---|---|---|---|
| Baker et al. 2015 | Arbitrary Visits | +/- 14 days | N/A |
| Braun et al. 2016 | 0mo., 12mo. | \(t_12\): +/- 60 days | N/A |
| Janney et al. 2016 | 0mo., 6mo., 12mo. | \(t_0\): +/- 30 days | (91, 600) |
| \(t_{6mo., 12mo.}\): +/- 60 days | (72, 650) | ||
| Garvin et al. 2015 | Collect All | N/A | N/A |
| Garvin & Marion 2015 | Collect All | N/A | N/A |
| Garvin & Hardy 2016 | 0wk., 2wk., 4wk., 26wk., 52wk., 104wk. | N/A | N/A |
| Grabarczyk et al. 2017 | 0wk., 12wk., 24wk., 36wk. | N/A | N/A |
| Huizinga et al. 2010 | 0mo., 12mo. | \(t_12\): +/- 90 days | (50, 700) |
| Kahwati et al. 2011 | 0mo., 6mo. | \(t_0\): +/- 30 days | N/A |
| \(t_{6mo.}\): +/- 60 days | N/A | ||
| Romanova et al. 2013 | -1yr, 0, 0.25yr, 0.5yr, 1yr, 2yr, 3yr | \(t_{-1yr, 1yr, 2yr, 3yr}\): +/- 3mo. | N/A |
| \(t_{0.25, 0.5}\): +/- 1mo. | N/A | ||
| Xiao et al. 2017 | -1yr, 0yr, 0.25yr, 2yr | \(t_0\): +/- 14 days | N/A |
| \(t_{-1yr, 2yr}\): +/- 90 days | N/A | ||
| \(t_{0.25yr}\): +/- 30 days | N/A |
Run algorithm on our sample of weights weightSamples. For simplicity, we will subset the data to include only patients from 2016.
# subset data for sample
DF <- weightSamples %>%
filter(SampleYear == "2016" & !is.na(Weight)) %>%
distinct(PatientICN, WeightDate, Weight, .keep_all = TRUE)
# function call
janney2016.df <- Janney2016.f(
DF = DF,
id = "PatientICN",
measures = "Weight",
tmeasures = "WeightDateTime",
startPoint = "VisitDateTime"
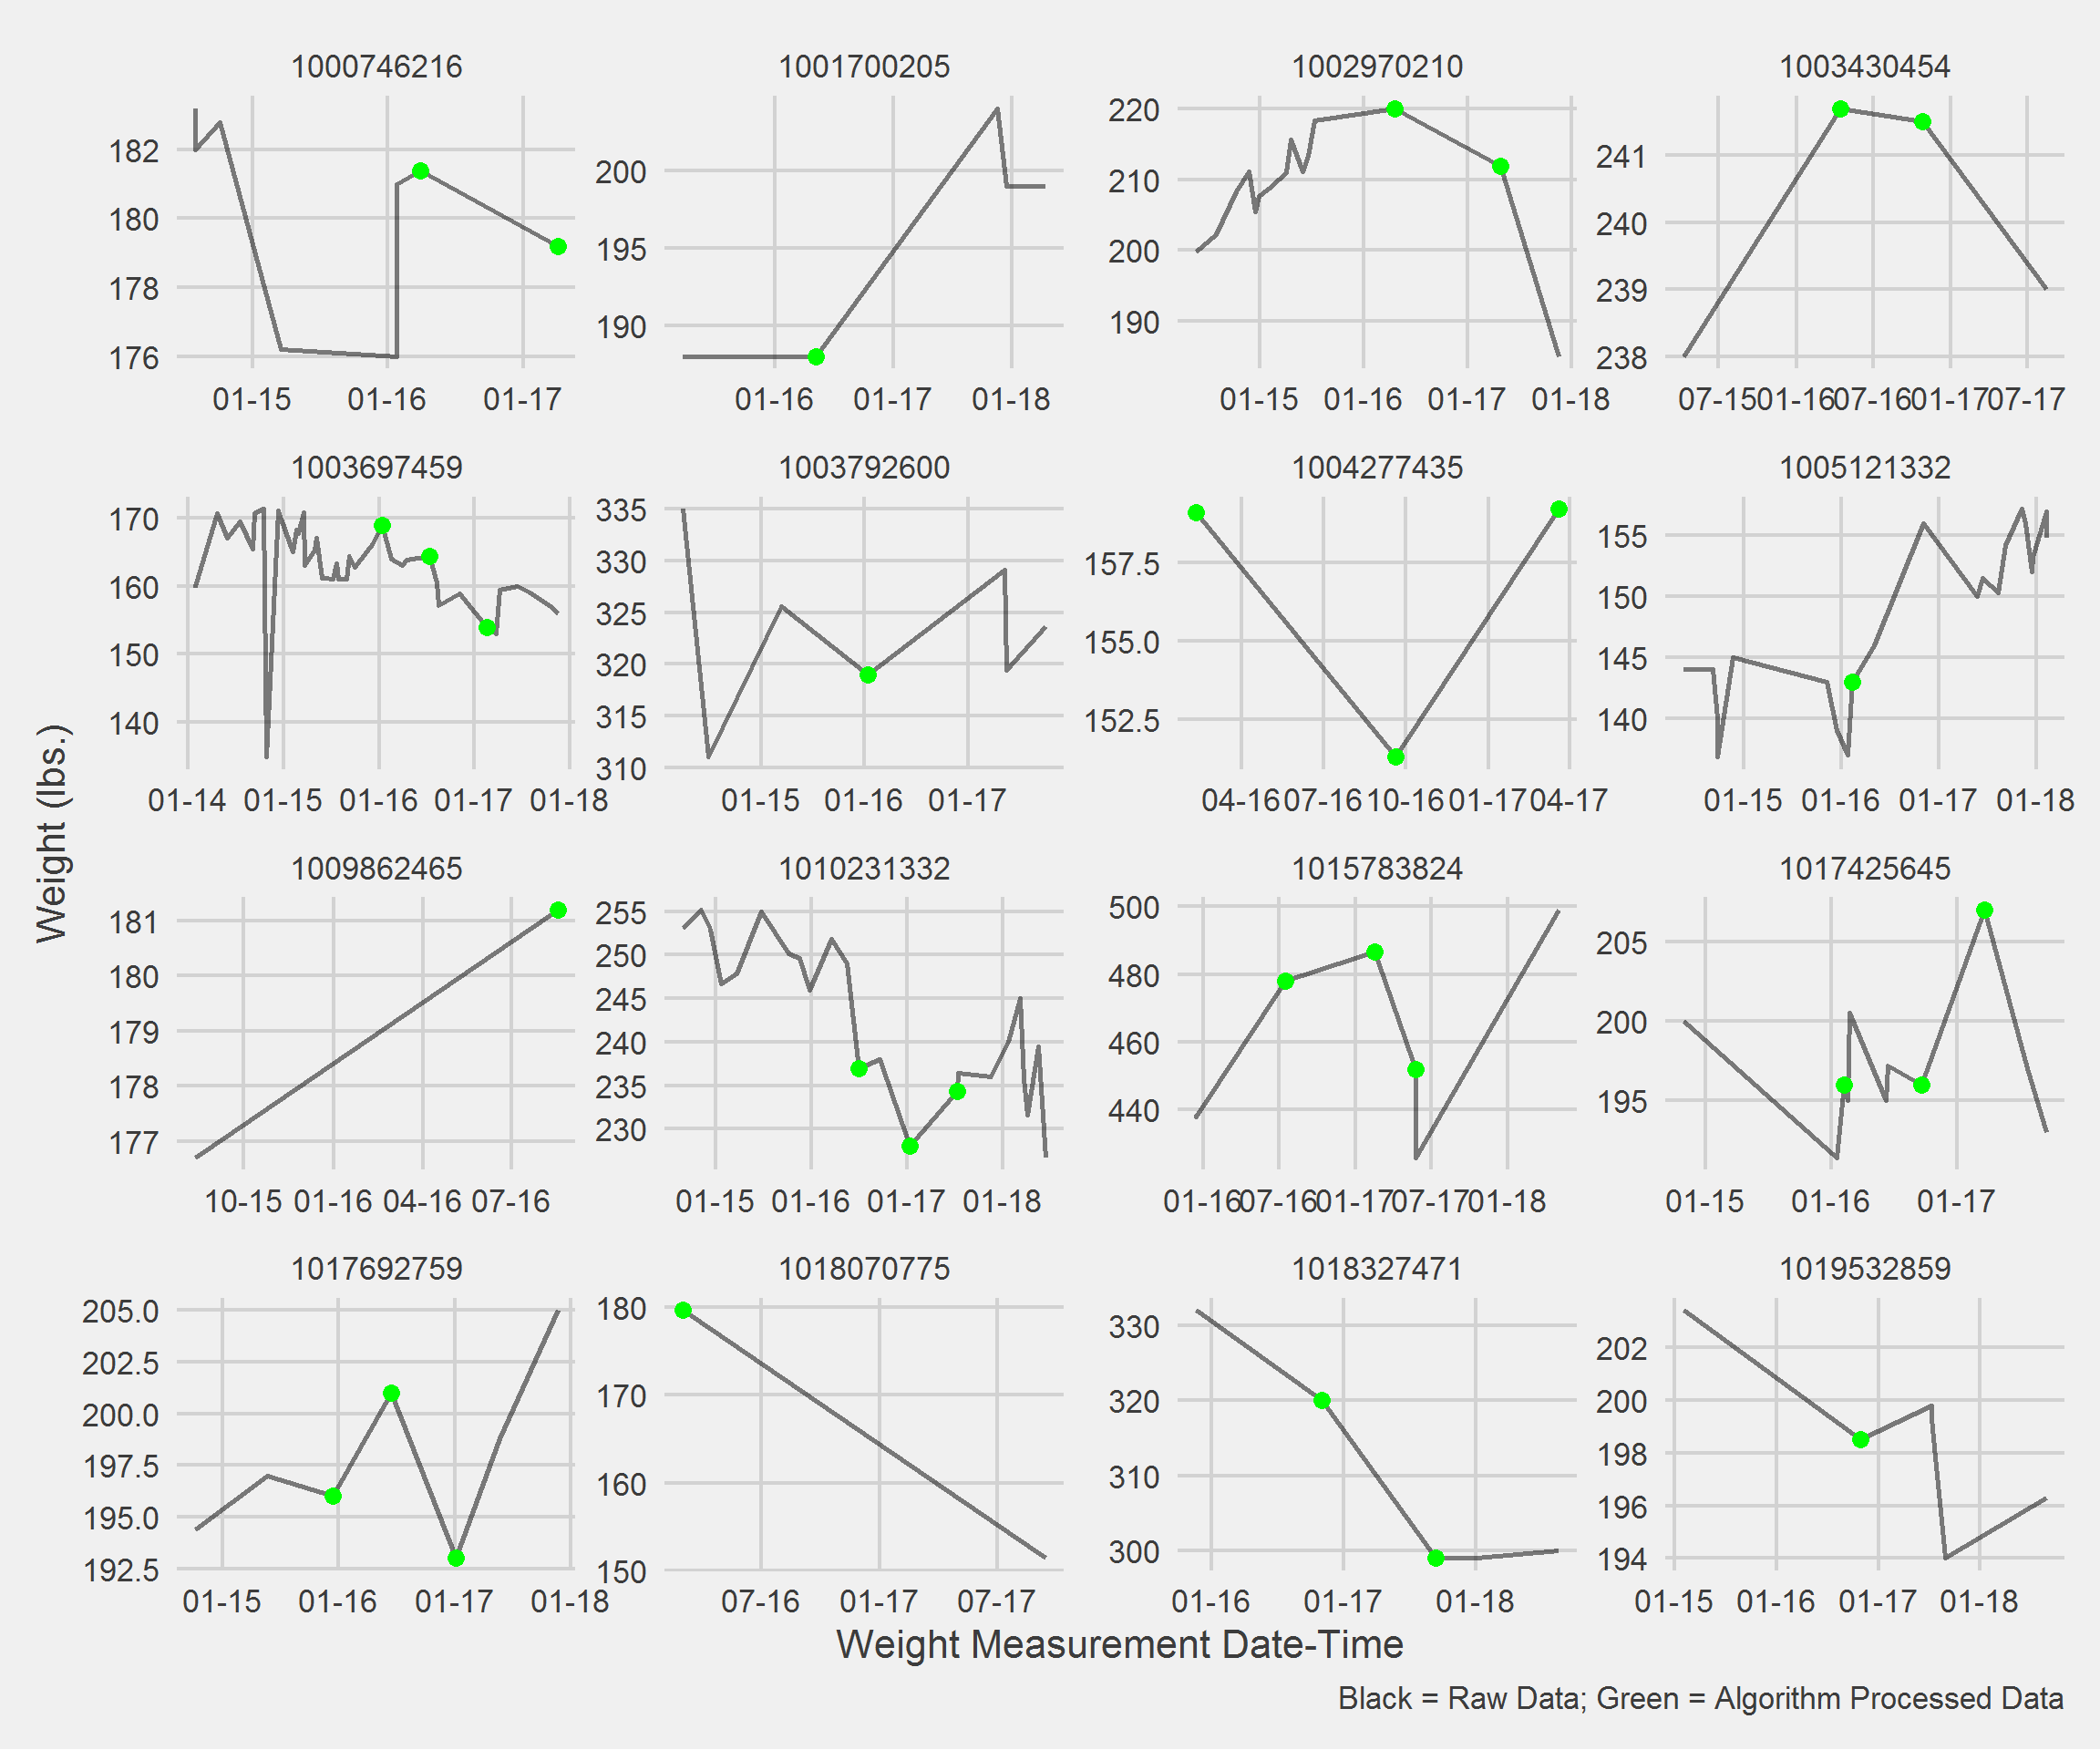
)Displaying a Vignette of 16 selected patients with at least 1 weight observation removed.
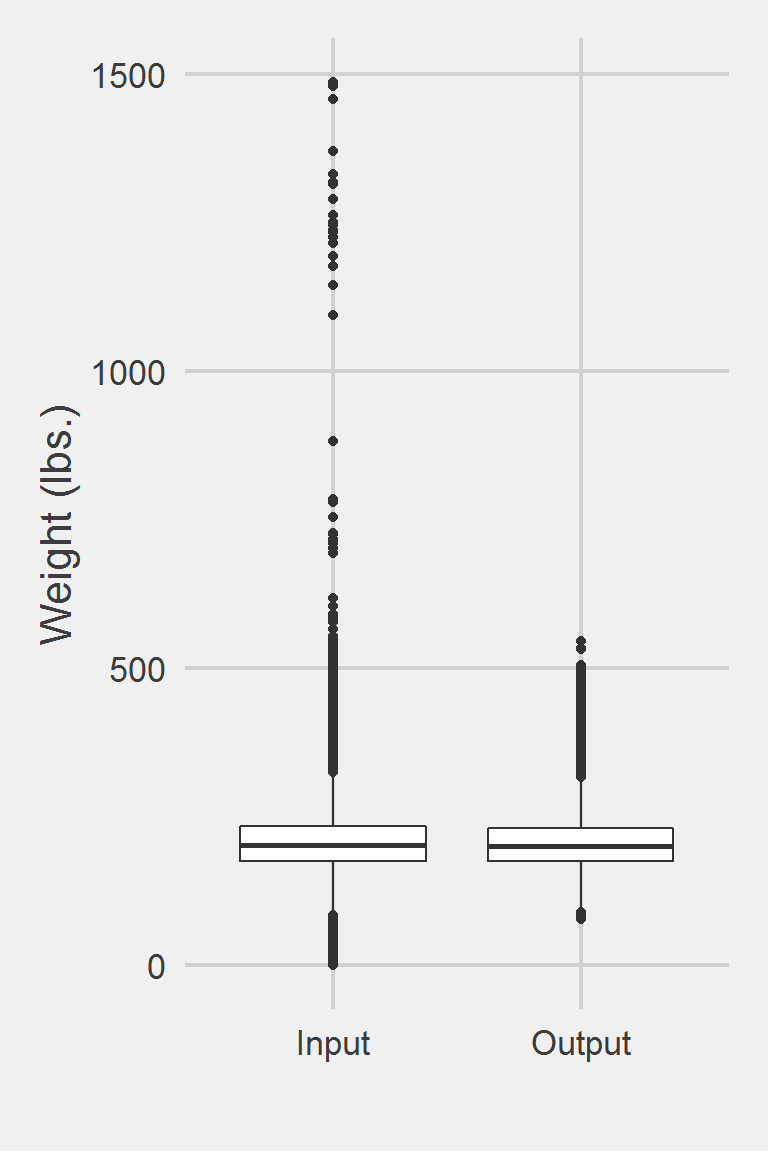
Distribution of Weight Measures between Raw & Algorithm-Processed values
 Descriptive statistics by group
group: Input
   vars       n   mean   sd median trimmed   mad min    max  range skew
X1    1 1175995 207.82 48.6  202.3  204.62 44.18   0 1486.2 1486.2 0.98
   kurtosis   se
X1      5.6 0.04
------------------------------------------------------------
group: Output
   vars      n   mean    sd median trimmed   mad  min max range skew kurtosis
X1    1 199830 206.15 45.46    201  203.17 41.51 78.4 546 467.6 0.81     1.49
    se
X1 0.1
Left boxplot is raw data from the sample of 2016, PCP visit subjects while the right boxplot describes the output from running windowCleaner.f()