Buta 2018
Probably the most simplistic and probably silliest, method
Excerpt from published methods
For each participant, we used VA electronic health record (EHR) data to obtain all BMI measurements available from the date of their first medical visit through September 30, 2010. Because we were interested in BMI change over time, we excluded participants who had no or only one BMI measurement available (260,193 participants left) … BMI was computed based on height and weight data routinely collected and recorded in EMR records during VA clinical visits. We removed from analyses a small percentage (0.03%) of biologially implausible BMI values (BMI<11 or BMI>70).
The fundamental aspect of this algorithm is the removal of veterans from the cohort if they only have \(\leq 1\) measurement available.
Arterburn et al. 2013 use the same algorithm, but only for a single time point.
Translation in Pseudocode
Algorithm in R Code
#' @title Buta et al. 2018 Measurment Cleaning Algorithm
#' @param DF object of class `data.frame`, containing `id` and `measures`
#' @param id string corresponding to the name of the column of patient identifiers in `DF`
#' @param measures string corresponding to the name of the column of measurements in `DF`
#' @param tmeasures string corresponding to the name of the column of measurement collection dates or times in `DF`. If `tmeasures` is a date object, there may be more than one weight on the same day, if it precise datetime object, there may not be more than one weight on the same day
#' @param outliers numeric vector corresponding to the upper and lower bound of `measure` for each time entry. Default is `c(11, 70)` for BMI measurements according to "Buta et al. 2018".
Buta2018.f <- function(DF,
                       id,
                       measures,
                       tmeasures,
                       outliers = c(11, 70)) {

  if (!require(data.table)) install.packages("data.table")
  if (!require(dplyr))      install.packages("dplyr")

  tryCatch(
    if (!is.numeric(DF[[measures]])) {
      stop(
        print("measure data must be a numeric vector")
      )
    }
  )

  tryCatch(
    if (!is.numeric(outliers)) {
      stop(
        print("outliers must be numeric")
      )
    }
  )

  # remove NA measures
  DF <- DF[!is.na(DF[[measures]]), ]

  # Remove Outlier Measures
  DF <- DF[DF[[measures]] >= outliers[1] & DF[[measures]] <= outliers[2], ]

  # convert to data.table
  DT <- data.table::as.data.table(DF)
  data.table::setkeyv(DT, id)

  # Set Order
  data.table::setorderv(DT, c(id, tmeasures), c(1, 1))

  # find max count for person i, if k = 1, remove person
  DT[, k := .(.N), by = .(PatientICN)]
  DT <- DT[k > 1, -c("k")]
  DT
}
Algorithm in SAS Code
Example in R
Need BMI for this algorithm and thus need to add height values; The concensus is to use the mode of height for each person to calculate BMI.
# Attach Height and compute BMI
DF <- DF %>%
  left_join(
    ModeOfHeight %>%
      select(-freq),
    by = "PatientICN"
  ) %>%
mutate(BMI = 703 * Weight / (Height ^ 2))Distribution of Weight Measurements between Raw and Algorithm-Processed Values
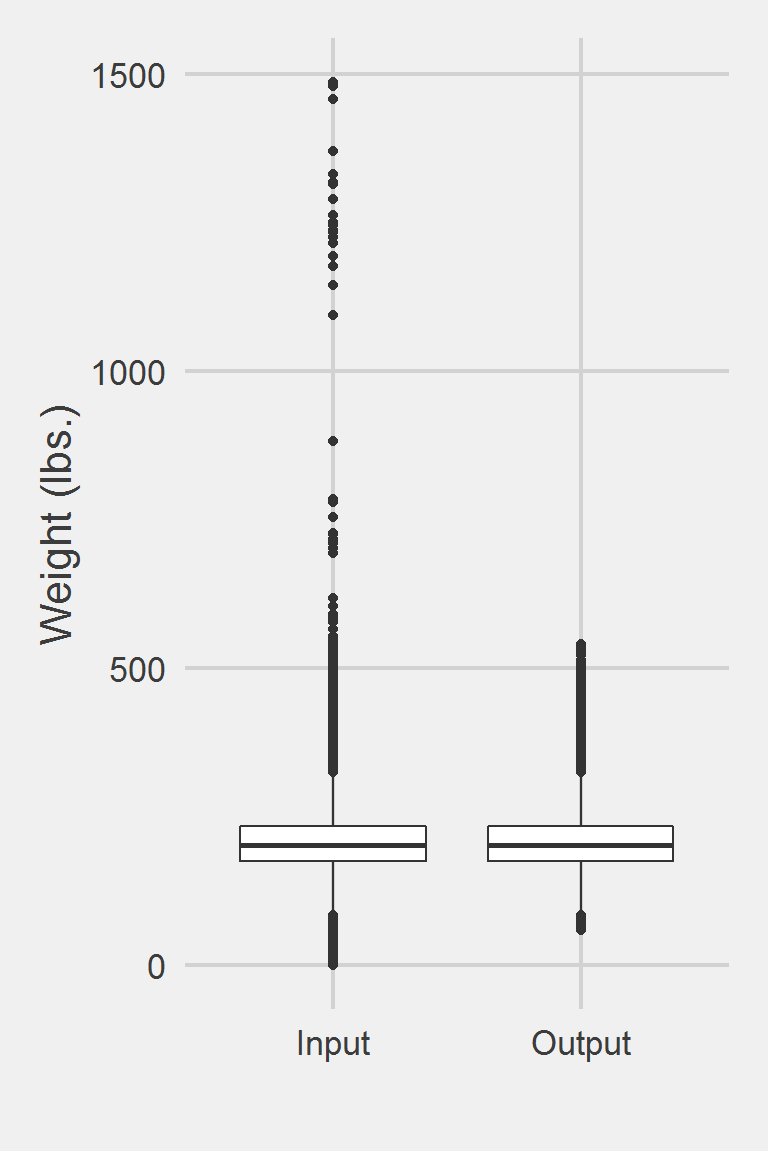
 Descriptive statistics by group
group: Input
   vars       n   mean   sd median trimmed   mad min    max  range skew
X1    1 1175995 207.82 48.6  202.3  204.62 44.18   0 1486.2 1486.2 0.98
   kurtosis   se
X1      5.6 0.04
------------------------------------------------------------
group: Output
   vars       n   mean    sd median trimmed   mad min max range skew kurtosis
X1    1 1131996 207.91 48.29  202.6  204.73 44.18  60 540   480  0.8     1.38
     se
X1 0.05
We won’t show a vignette for Buta et al. 2018 as it just excludes people and keeps only those with a certain number of measurements.
Left boxplot is raw data from 2016, PCP visit subjects while the right boxplot describes the output from running Buta2018.f()