Littman 2012
Excerpt from published methods
For weight, height, and body mass index, we first removed biologically implausible values (weight <75 lb or >600 lb, height <49 in or >94 in, and body mass index >80 kg/m ). Next, we applied algorithms to identify measures that were plausible but appeared to be erroneous on the basis of a review of all recorded weights and heights during the relevant time period. After reviewing records that had large standard deviations (SDs) (explained in more detail below), we used the algorithm that follows to exclude values that were likely erroneous while keeping values that were plausible. We excluded any weight measurements that met the following 2 criteria: 1) the difference between the mean weight and weight in question was greater than the SD and 2) the SD was greater than 10% of the mean. For example, 1 participant’s weight in pounds was recorded as 300 and 160 lb, both measured on December 7, 2005, 310 lb measured on June 12, 2006, 276 lb measured on August 8, 2006, 291 lb measured on August 15, 2006, and 291 lb measured on September 13, 2007, resulting in mean (SD) of 271.3 (55.7) lb. The weight of 160 lb recorded on December 7, 2005, was considered erroneous and dropped because the difference between the index weight and mean weight was greater than the SD (271 − 160 = 113.3 lb) and the SD was greater than 10% of the mean of all weights ([55.7/271.3] × 100 = 20.5%).
Translation in Pseudocode
DEFINE person i IN 1:I, j date IN 1:J, weight k IN 1:K (additional recorded weight, same day)
FOR i IN 1:I
    FOR j IN 1:J
        FOR k IN 1:K
            weight_ijk := weight for ith person on jth date and kth weight
        END FOR
    END FOR
    IF (weight_ijk < 75 lbs OR weight_ijk > 600 lbs)
        weight_ijk := NA
    MEAN_i := MEAN({weight_i}_jk)
    SD_i := SD({weight_i}_jk)
    IF (ABS(MEAN_i - weight_ijk) > SD_i & SD_i > 0.10 * MEAN_i)
        weight_ijk := NA
END FOR
Algorithm in R Code
This algorithm below assumes all weight data has already been collected, in contrast with the pseudocode.
#' @title Littman 2012 Measurment Cleaning Algorithm
#' @param DF object of class data.frame, containing `id` and `measures`
#' @param id string corresponding to the name of the column of patient identifiers in `df`
#' @param measures string corresponding to the name of the column of measurements in `df`
#' @param tmeasures string corresponding to the name of the column of measurement collection dates or times in `df`. If `tmeasures` is a date object, there may be more than one weight on the same day, if it precise datetime object, there may not be more than one weight on the same day
#' @param outliers object of type `list` with numeric inputs corresponding to the upper and lower bound for each time entry. Default is `list(LB = c(75), UB = c(600))`
#' @param SDthreshold numeric scalar to be multiplied by the `meanMeasures` per `id`. E.g., from Littman 2012, "...We excluded any weight measurements that met the following 2 criteria: 1) the difference between the mean weight and weight in question was greater than the SD and 2) the SD was greater than 10% of the mean...." implies `SDthreshold`= 0.10
#' @return input data.frame with additional columns: `InputMeasurement`, the original weight data; `OutputMeasurement`, algorithm output; `meanWeight`, mean(weights) per `id`; `SDWeight`, SD(weights) per `id`; `SD_threshold_`, Mean(weights) * `SDthreshold`
Littman2012.f <- function(DF,
                          id,
                          measures,
                          tmeasures,
                          outliers = list(LB = c(75), UB = c(600)),
                          SDthreshold = 0.10) {

  if (!require(dplyr))      install.packages("dplyr")
  if (!require(data.table)) install.packages("data.table")

  tryCatch(
    if (!is.numeric(DF[[measures]])) {
      stop(
        print("measure data must be a numeric vector")
      )
    }
  )

  tryCatch(
    if (!is.list(outliers)) {
      stop(
        print("outliers must be placed into a list object")
      )
    }
  )

  # Compute the mean and sd for each persons weight, if more than 1 value
  # if not more than 1 value, mean is finite, sd is undefined
  # convert to data.table
  DT <- data.table::as.data.table(DF)
  setkeyv(DT, id)

  # first set outliers to NA
  DT[,
     measures_aug_ := ifelse(get(measures) < outliers[[1]]
                             | get(measures) > outliers[[2]],
                             NA,
                             get(measures))
     ]

  # calc mean of measures per group
  DT[, meanMeasures := mean(measures_aug_, na.rm = TRUE), by = id]
  # calc SD of weight per group
  DT[, SDMeasures := sd(measures_aug_,   na.rm = TRUE), by = id]
  # calc SD threshold
  DT[, SD_threshold_ := SDthreshold * meanMeasures, by = id]

  # exclude any measurements that meet the following 2 criteria:
  # 1) the difference between the meanMeasures and measures_aug_ in
  # question is greater than the SDMeasures
  # AND
  # 2) the SDMeasures was greater than SD_threshold_ of the mean
  DT[, cond1 := ifelse(abs(measures_aug_ - meanMeasures) > SDMeasures, T, F)]
  DT[, cond2 := ifelse(SDMeasures > SD_threshold_, T, F)]
  DT[, measures_aug_ := ifelse((cond1 & cond2), NA, measures_aug_)]

  # return augmented measurements
  DF <- as.data.frame(DT)
  names(DF)[names(DF) == measures] <- "InputMeasurement"
  names(DF)[names(DF) == "measures_aug_"] <- "OutputMeasurement"
  DF
}
Algorithm in SAS Code
/*
title: Littman 2012 Weight Measurment Algorithm
param: df: table containing id and weights
param: id: string corresponding to the name of the column of patient IDs in df
param: weights: string corresponding to the name of the column of weights in df
param: tweights: string corresponding to the name of the column of weight dates
         or times in df. If tweights is a date object, there may be more than one
         weight on the same day, if it precise datetime object, there may not be
         more than one weight on the same day.
param: outliers: numeric inputs corresponding to the upper and lower bound
param: SDthreshold: numeric scalar to be multiplied by the `meanWeight`
       per `id`. E.g., from Littman 2012, "...We excluded any weight
       measurements that met the following 2 criteria: 1) the difference
       between the mean weight and weight in question was greater than the SD
       and 2) the SD was greater than 10% of the mean...." implies
       `SDthreshold`= 0.10
*/

%MACRO Littman2012(df = ,
                           id = ,
                           measures = ,
                           tmeasures = ,
                           outliers = ,
                         SDthreshold = );

    * Step 1: set outliers to NA;
    DATA dt;
        SET &df;
            IF &measures < %scan(&outliers, 1, ' ')
                OR &measures > %scan(&outliers, 2, ' ')
            THEN measures_aug_ = .;
            ELSE measures_aug_ = &measures;
    RUN;

    * Step 2: compute mean, sd, SD threshold of measures per group id;
    PROC MEANS DATA = dt NOPRINT NWAY;
        CLASS &id;
        VAR measures_aug_;
        OUTPUT OUT = dt2 (DROP = _TYPE_ _FREQ_)
               MEAN = meanMeasures
               STDDEV = SDMeasures;
    RUN;

    PROC SQL;
        CREATE TABLE descByGroup AS
            SELECT a.*,
                   b.meanMeasures,
                   b.SDMeasures,
                   (&SDthreshold * b.meanMeasures) AS SD_threshold_
                FROM dt AS a INNER JOIN dt2 AS b ON a.&id = b.&id;
    QUIT;

    /*
    Step 3: exclude any measurements that meet the following 2
            criteria: 1) the difference between the meanMeasures
                and measures_aug_ in question is greater than the SDMeasures
                AND 2) the SDMeasures is greater than the SD_threshold_
  */

    DATA outputData;
        SET descByGroup;
            IF (ABS(measures_aug_ - meanMeasures) > SDMeasures)
                THEN cond1 = 1;
            ELSE cond1 = 0;
            IF (SDMeasures > SD_threshold_)
                THEN cond2 = 1;
            ELSE cond2 = 0;
            IF (cond1 = 1 AND cond2 = 1)
                THEN measures_aug_ = .;
        RENAME measures_aug_ = outputMeasurement;
    RUN;

%MEND Littman2012;
Example in R
Using a small data frame with the example given in the supplemental materials to Littman 2012:
| PatientICN | Weight | WeightDate |
|---|---|---|
| 1010528308 | 300 | 2005-12-07 |
| 1010528308 | 160 | 2005-12-07 |
| 1010528308 | 310 | 2006-06-12 |
| 1010528308 | 276 | 2006-08-08 |
| 1010528308 | 291 | 2006-08-15 |
| 1010528308 | 291 | 2007-09-01 |
Then applying the algorithm with the default settings
| PatientICN | InputMeasurement | WeightDate | OutputMeasurement | meanMeasures | SDMeasures | SD_threshold_ | cond1 | cond2 |
|---|---|---|---|---|---|---|---|---|
| 1010528308 | 300 | 2005-12-07 | 300 | 271.33 | 55.69 | 27.13 | FALSE | TRUE |
| 1010528308 | 160 | 2005-12-07 | NA | 271.33 | 55.69 | 27.13 | TRUE | TRUE |
| 1010528308 | 310 | 2006-06-12 | 310 | 271.33 | 55.69 | 27.13 | FALSE | TRUE |
| 1010528308 | 276 | 2006-08-08 | 276 | 271.33 | 55.69 | 27.13 | FALSE | TRUE |
| 1010528308 | 291 | 2006-08-15 | 291 | 271.33 | 55.69 | 27.13 | FALSE | TRUE |
| 1010528308 | 291 | 2007-09-01 | 291 | 271.33 | 55.69 | 27.13 | FALSE | TRUE |
Next example will run on the sample
Littman2012.df <- Littman2012.f(DF,
id = "PatientICN",
measures = "Weight",
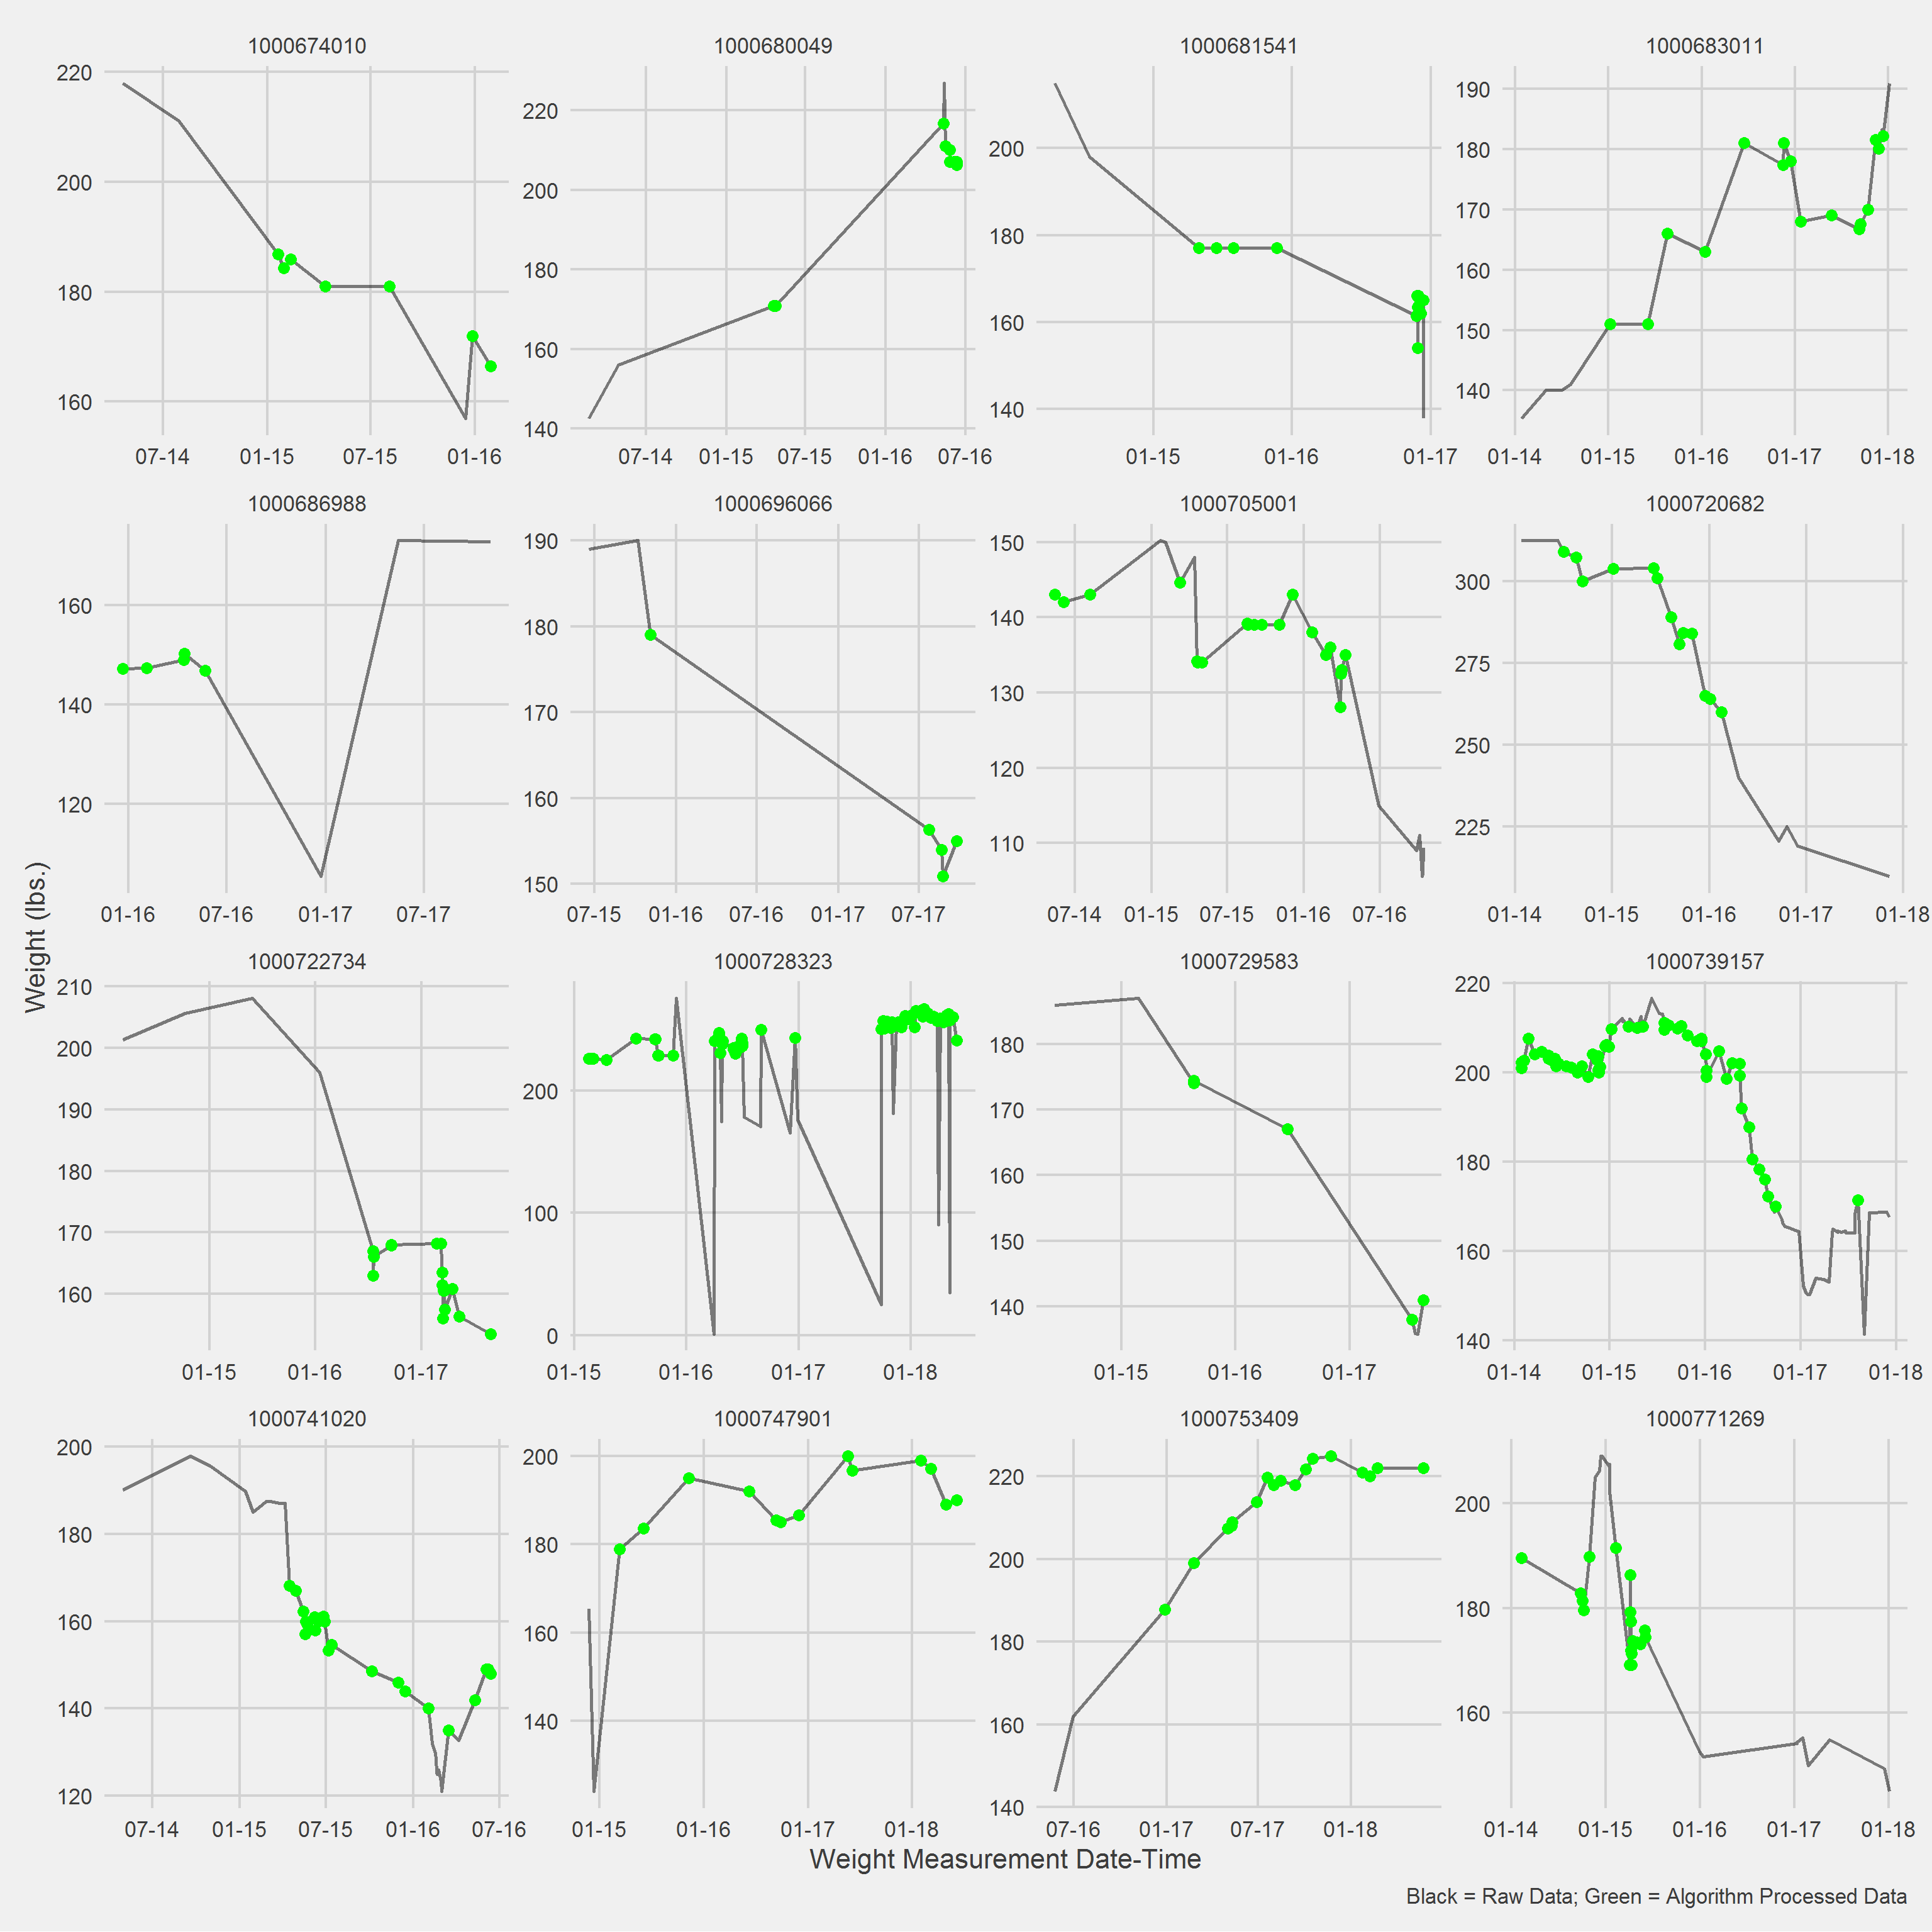
tmeasures = "WeightDateTime")Displaying a Vignette of 16 selected patients with at least 1 weight observation removed.
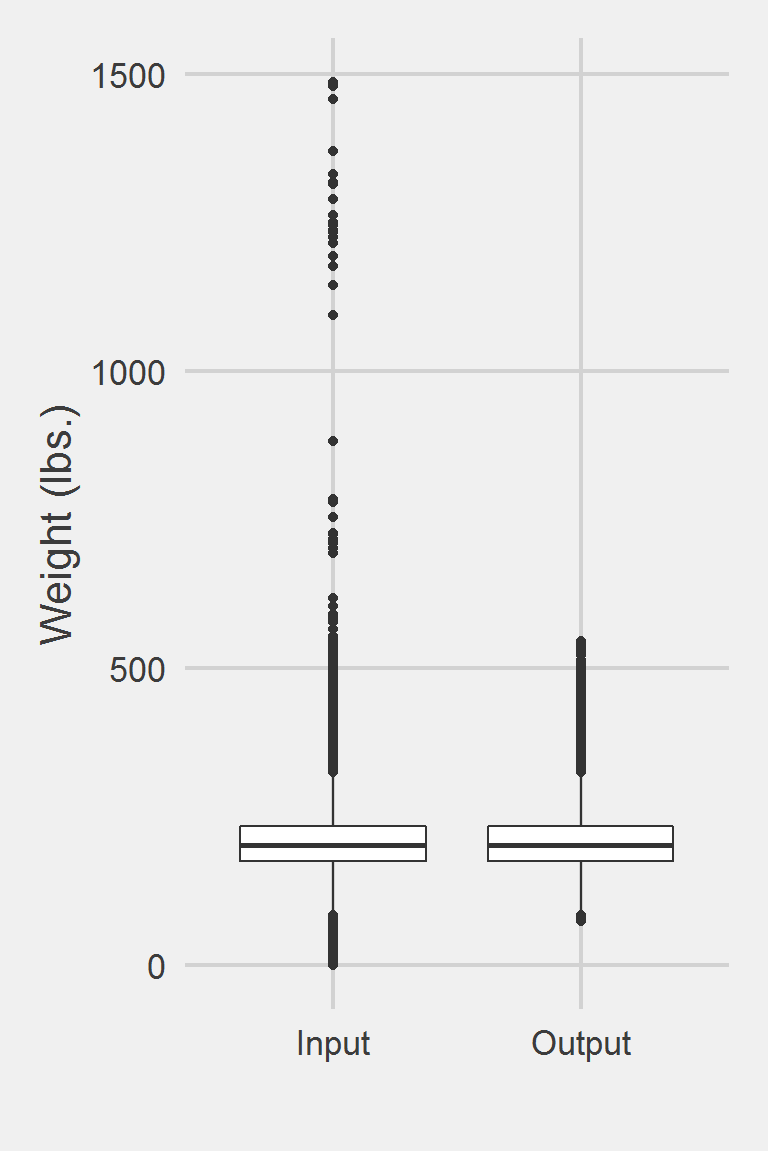
Distribution of raw weight data versus algorithm processed data
 Descriptive statistics by group
group: Input
   vars       n   mean   sd median trimmed   mad min    max  range skew
X1    1 1175995 207.82 48.6  202.3  204.62 44.18   0 1486.2 1486.2 0.98
   kurtosis   se
X1      5.6 0.04
------------------------------------------------------------
group: Output
   vars       n   mean    sd median trimmed   mad  min max range skew kurtosis
X1    1 1161661 207.97 48.14  202.6  204.77 44.03 75.2 546 470.8 0.81     1.41
     se
X1 0.04
Left boxplot is raw data from the sample of 2016, PCP visit subjects while the right boxplot describes the output from running Littman2012.f()