Breland 2017
Excerpt from published methods
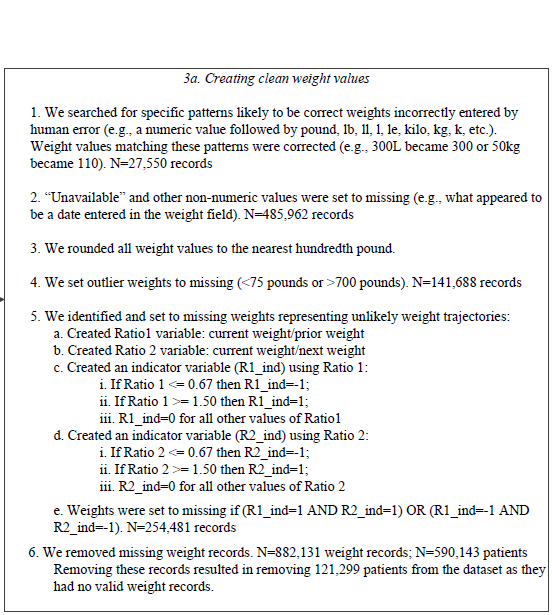
From Appendix 2:
Translation in pseudocode
DEFINE t_j, weight_j in 1:J
IF (type_of(weight)) == CHAR
    IF (weight contains extraneous non-numeric values)
        weight := RECODE(weight)
    weight := CAST(weight, NUMERIC)
weight := ROUND(weight, 2)
IF (weight == NA OR weight == 'unavailable')
    weight := NA
IF (weight < 75 lbs. OR weight > 700 lbs)
    weight := NA
DEFINE Ratio1 as current weight:prior weight
DEFINE Ratio2 as current weight:next weight
weight_{0} := weight_0 (initialize to baseline weight)
FOR j IN J
    Ratio1 := weight_j / weight_{j - 1}
        IF (Ratio1 <= 0.67)
            I(Ratio1) := -1
        ELSE IF (Ratio1 >= 1.50)
            I(Ratio1) := 1
        ELSE I(Ratio1) := 0
    Ratio2 := weight_j / weight_{j + 1}
        IF (Ratio2 <= 0.67)
            I(Ratio2) := -1
        ELSE IF (Ratio2) >= 1.50
            I(Ratio2) := 1
        ELSE I(Ratio2) := 0
    IF (I(Ratio1) = 1 AND I(Ratio2) = 1) OR (I(Ratio1) = -1 AND I(Ratio2) = -1)
        weight_j := NA
END FOR
Algorithm in R Code
#' @title Breland 2017 Measurment Cleaning Algorithm
#' @param DF object of class data.frame, containing `id` and `measures`
#' @param id string corresponding to the name of the column of patient identifiers in `DF`
#' @param measures string corresponding to the name of the column of measurements in `DF`
#' @param tmeasures string corresponding to the name of the column of measurement collection dates or times in `DF`. If `tmeasures` is a date object, there may be more than one weight on the same day, if it precise datetime object, there may not be more than one weight on the same day
#' @param outliers object of type `list` with numeric inputs corresponding to the upper and lower bound for each time entry. Default is `list(LB = 75, UB = 700)`
#' @param RatioThresholds list of 2 lists, 1 for each ratio (prior and post measurements), with numeric inputs corresponding to the lower bound and upper bound for flagging erroneous measurements. Default lower bound is 0.67 and upper bound 1.50, same as Breland et al. 2017
Breland2017.f <- function(DF,
                          id,
                          measures,
                          tmeasures,
                          outliers = list(LB = 75, UB = 700),
                          RatioThresholds = list(Ratio1 = list(low = 0.67,
                                                               high = 1.50),
                                                 Ratio2 = list(low = 0.67,
                                                               high = 1.50))) {

  if (!require(dplyr))      install.packages("dplyr")
  if (!require(data.table)) install.packages("data.table")

  tryCatch(
    if (!is.numeric(DF[[measures]])) {
      stop(
        print("measure data must be a numeric vector")
      )
    }
  )

  tryCatch(
    if (!is.list(outliers)) {
      stop(
        print("outliers must be placed into a list object")
      )
    }
  )

  # convert to data.table
  DT <- data.table::as.data.table(DF)
  setkeyv(DT, id)

  # Round to 2 decimal places
  DT[, measures_aug_ := round(get(measures), 2)]

  # Set outliers to NA
  DT[,
     measures_aug_ := ifelse(measures_aug_ < outliers[[1]]
                             | measures_aug_ > outliers[[2]],
                             NA,
                             measures_aug_)
     ]

  # Ratio1: current weight/prior weight (backward)
  # Ratio2: current weight/next weight (forward)
  setorderv(DT, c(id, tmeasures))

  # fast lead and lag with data.table
  DT[, "backward" := shift(measures_aug_, 1, NA, "lag"), by = id]
  DT[, "forward"  := shift(measures_aug_, 1, NA, "lead"), by = id]

  DT <- DT %>%
    mutate(
      Ratio1 = measures_aug_ / backward,
      R1_ind = case_when(
        Ratio1 <= RatioThresholds[[1]][[1]] ~ -1L,
        Ratio1 >= RatioThresholds[[1]][[2]] ~  1L,
        TRUE ~ 0L
      ),
      Ratio2 = measures_aug_ / forward,
      R2_ind = case_when(
        Ratio2 <= RatioThresholds[[2]][[1]] ~ -1L,
        Ratio2 >= RatioThresholds[[2]][[2]] ~  1L,
        TRUE ~ 0L
      ),
      measures_aug_ = ifelse((R1_ind == 1 & R2_ind == 1) |
                               (R1_ind == -1 & R2_ind == -1),
                             NA,
                             measures_aug_)
    )
  DT
}
Algorithm in SAS Code
Example in R
The function Breland2017.f will make sure that weight is coded numerically, if not it stops and spits a message back out telling the user to recode as a numeric variable and therefore, can’t have any non-numeric characters in the field.
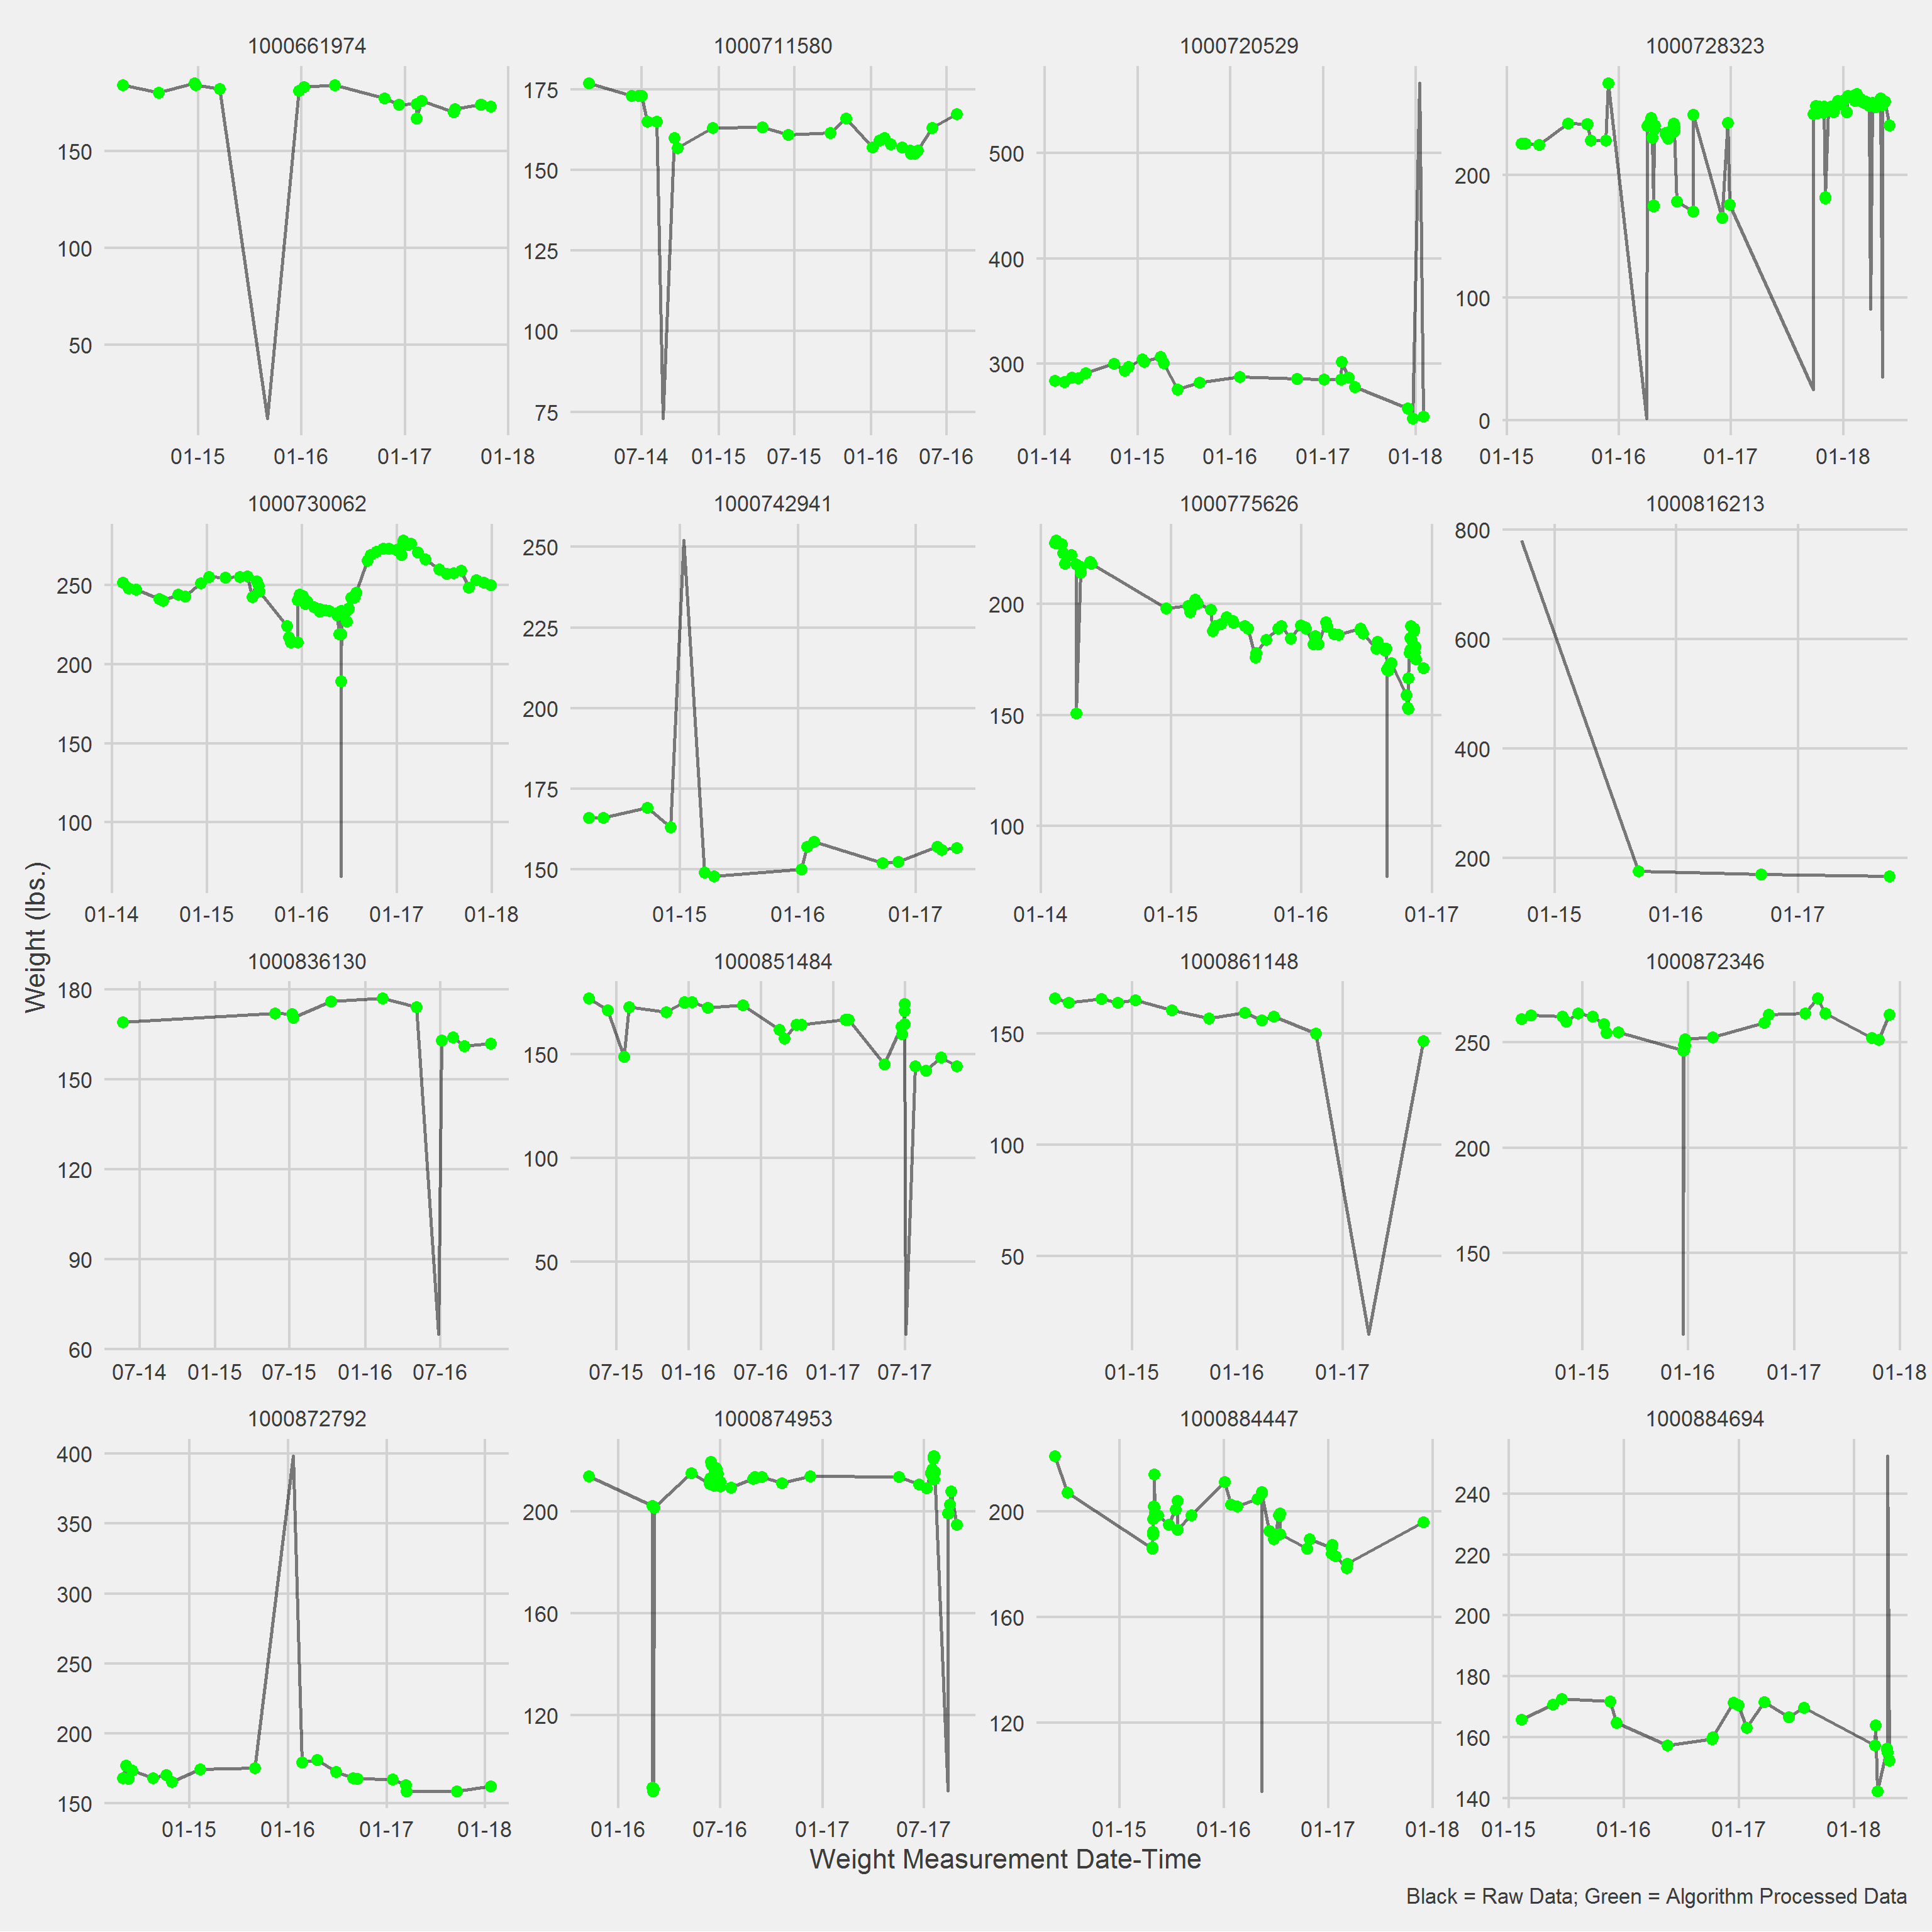
Displaying a Vignette of 16 selected patients with at least 1 weight observation removed.
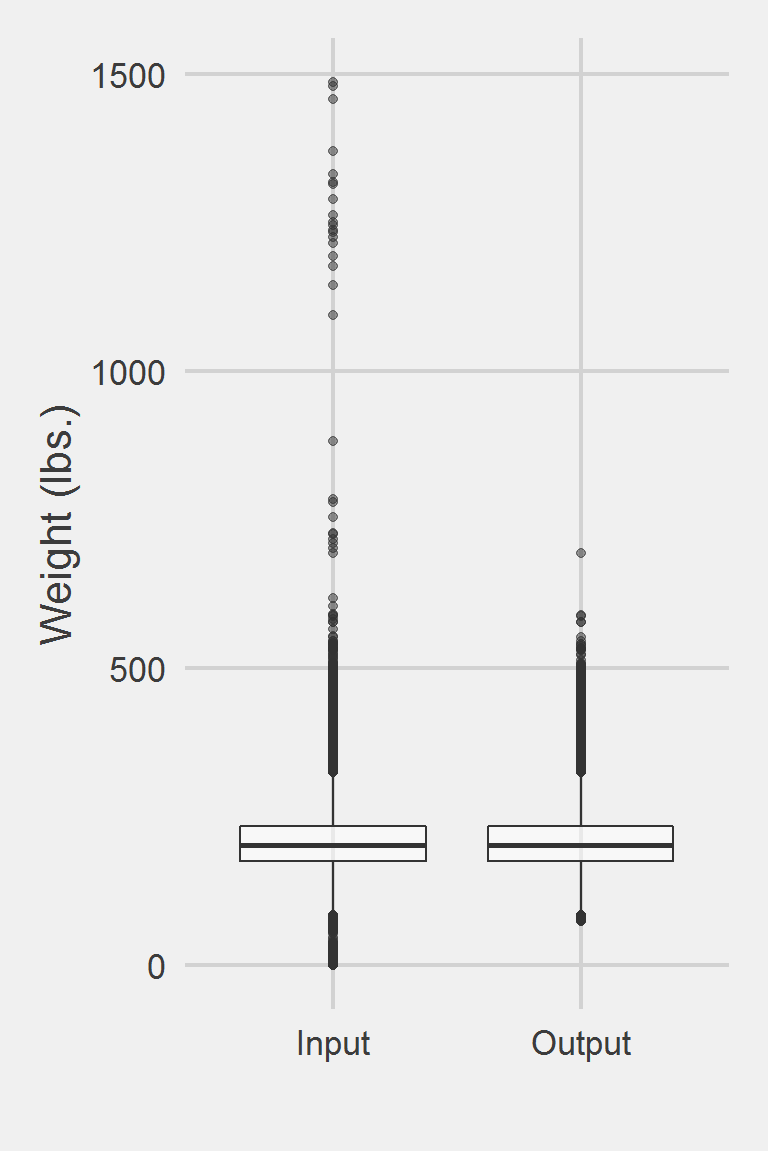
Distribution of raw weight data versus algorithm processed data
 Descriptive statistics by group
group: Input
   vars       n   mean   sd median trimmed   mad min    max  range skew
X1    1 1175995 207.82 48.6  202.3  204.62 44.18   0 1486.2 1486.2 0.98
   kurtosis   se
X1      5.6 0.04
------------------------------------------------------------
group: Output
   vars       n   mean    sd median trimmed   mad min    max  range skew
X1    1 1175177 207.85 48.25  202.4  204.65 44.18  75 694.46 619.46 0.81
   kurtosis   se
X1     1.42 0.04
Left boxplot is raw data from the same of 2016, PCP visit subjects while the right boxplot describes the output from running Breland2017.f()