34 Selecting an analysis
So far, you have learnt about the research process, including analysing data using confidence intervals and conducting hypothesis tests. In this chapter, you will learn to:
- select the correct analysis.
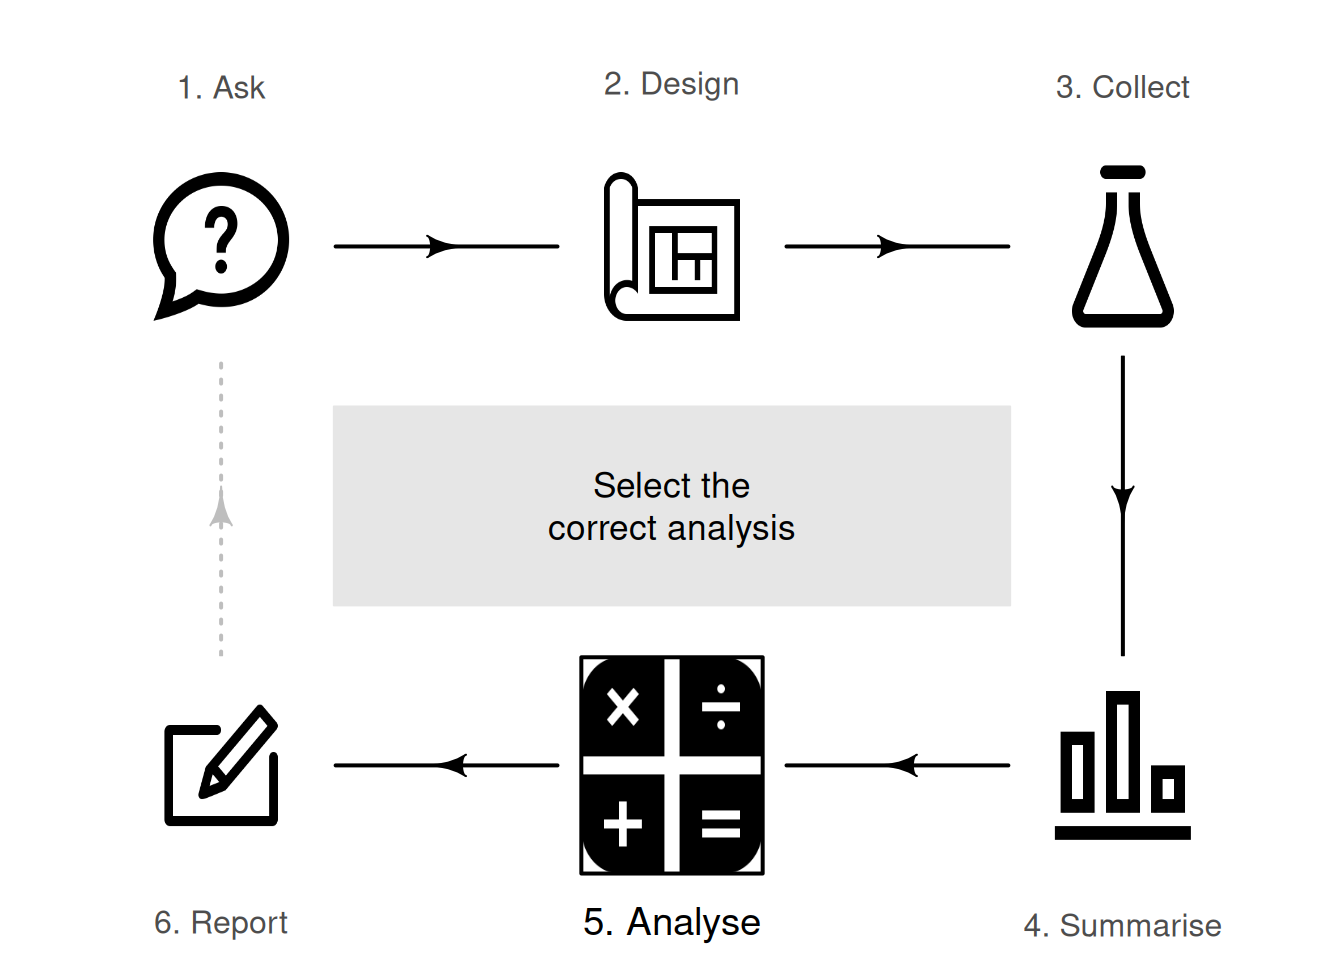
34.1 About selecting an appropriate analysis
Selecting the correct CI or hypothesis test can be challenging, and this book only describes a few possible scenarios. For the situations studied in this book, identifying the type of RQ (e.g., descriptive or correlational), and the number and type of variables (qualitative or quantitative) is important (Table 34.1). Appendix C may also prove useful.
Example 34.1 (Selecting an analysis) Bjornsson et al. (2021) studied whether the 'presence of a prehospital physician improves survival from cardiac arrest' (p. 227). They studied 471 cardiac arrests: \(200\) treated by prehospital physicians (2004 to 2007), and \(271\) treated by emergency medical technicians (2008 to 2014).
For each cardiac admission (the unit of analysis), two variables are recorded. Whether a prehospital physician is present (the explanatory variable) is qualitative with two levels (Yes; No). Whether a patient survived (the response variable) is qualitative with two levels (Yes; No). They compared the survival proportions for the two scenarios; this is a relational RQ.
To study the proportion of survivors for each scenario, a \(z\)-test for the difference between proportions (and corresponding CI) would be used. Alternatively, a \(\chi^2\)-test for comparing the odds of survival (and a CI for the OR) could also be used.
Example 34.2 (Selecting an analysis) Lyons, Felton, and McCabe (2023) studied the relationship between the ball release speed (BRS) and the height of female cricket players, and BRS and arm length. Since they are exploring the relationship between two pairs of quantitative variables, both RQs are correlational RQs.
If the relationships are approximately linear (determined by examining the two scatterplots), a test for correlations (and corresponding CI) would be used, for one each relationship to be studied. Alternatively, a linear regression model could be fitted (one for each relationship), and a test for the slope of the fitted regression equation (and corresponding CI) could be conducted.
Example 34.3 (Selecting an analysis) Hitt et al. (2023) studied the impact of soil lead levels in New Orleans (USA) neighbourhoods on northern mockingbirds (p. 2):
We tested the hypothesis that nestling mockingbird lead levels in blood and feathers differ with respect to neighborhood soil lead levels...
They compared the mean lead concentration in blood, for birds in neighbourhoods with low and with high lead levels. They also compared the mean lead concentration in feathers, for birds in neighbourhoods with low and high lead levels. These are both relational RQs.
For each bird (the unit of analysis), three variables were recorded. The lead levels (the explanatory variable) is qualitative with two levels: high lead-level neighbourhoods, and low lead-level neighbourhoods. The blood lead concentrations (one response variable) is quantitative (continuous). The lead concentrations in feathers (another response variable) is quantitative (continuous).
To study the difference between the mean lead concentrations in the two groups, a two-sample \(t\)-test for the difference between the means (and the corresponding CI) is needed (provided the statistical validity assumptions are met). One test is needed for comparing blood lead concentrations, and another for comparing concentrations in feathers.
34.2 Exercises
Answers to odd-numbered exercises are given at the end of the book.
Exercise 34.1 Identify which of these statistics do not have a sampling distribution well-modelled by a normal distribution. Explain your answer.
- The difference between two sample means \(\bar{x}_1 - \bar{x}_2\), with samples of size \(n_1 = 55\) and \(n_2 = 61\), but slightly right-skewed distributions of the data for each sample.
- The sample slope in a regression equation \(b_1\), with an approximate linear relationship between the variables, approximately constant variation in the values of \(y\), and \(n = 24\).
- The sample OR, with both samples of size \(n = 43\).
Exercise 34.2 Identify which of these statistics do not have a sampling distribution well-modelled by a normal distribution. Explain your answer.
- The sample mean of a set of differences \(\bar{d}\), with a sample of \(n = 32\) difference, but the distribution of the differences are slightly right-skewed.
- The sample correlation coefficient \(r\), with an approximate linear relationship between the variables, approximately constant variation in the values of \(y\), and \(n = 29\).
- The sample proportion \(\hat{p}\), with \(n = 26\) and \(\hat{p} = 0.154\).
Exercise 34.3 Suppose researchers compare the mean number of hours of exercise per week for the same British office workers, both in summer and in winter, to study the mean change.
What methods would be a suitable for creating a summary and performing analyses?
Exercise 34.4 Castro-Maqueda et al. (2019) estimated the difference between the mean number of hours of sunlight exposure per day for physical education teachers and non-physical education teachers in Spain.
What methods would be a suitable for creating a summary and performing analyses?
Exercise 34.5 Suppose researchers wanted to study the proportion of koalas that live in regions with tree canopies of different heights (classified as Class 1 (highest canopy height) to Class 4 (lowest canopy height)) in the 'core' areas (areas of intensive use and feeding) and non-core areas (based on Mitchell, Soto-Berelov, and Jones (2023)).
What methods would be a suitable for creating a summary and performing analyses?
Exercise 34.6 K. Chen et al. (2018) studied the relationship between the mass and the length of crocodile eggs.
What methods would be a suitable for creating a summary and performing analyses?
Exercise 34.7 Meadley et al. (2021) studied the relationship between maximal aerobic capacity (VO2peak) while swimming, and the maximal aerobic capacity while running, in helicopter rescue paramedics.
What methods would be a suitable for creating a summary and performing analyses?
Exercise 34.8 Suppose researchers are wanting to estimate the difference between the mean number of hours spent on social media for Indian people aged over \(30\), to people aged \(30\) and under.
What methods would be a suitable for creating a summary and performing analyses?
The following short video may help explain some of these concepts. Note that the test for correlation and regression have not yet been covered in this book (but they will be in the next few chapters).