24 More details about CIs
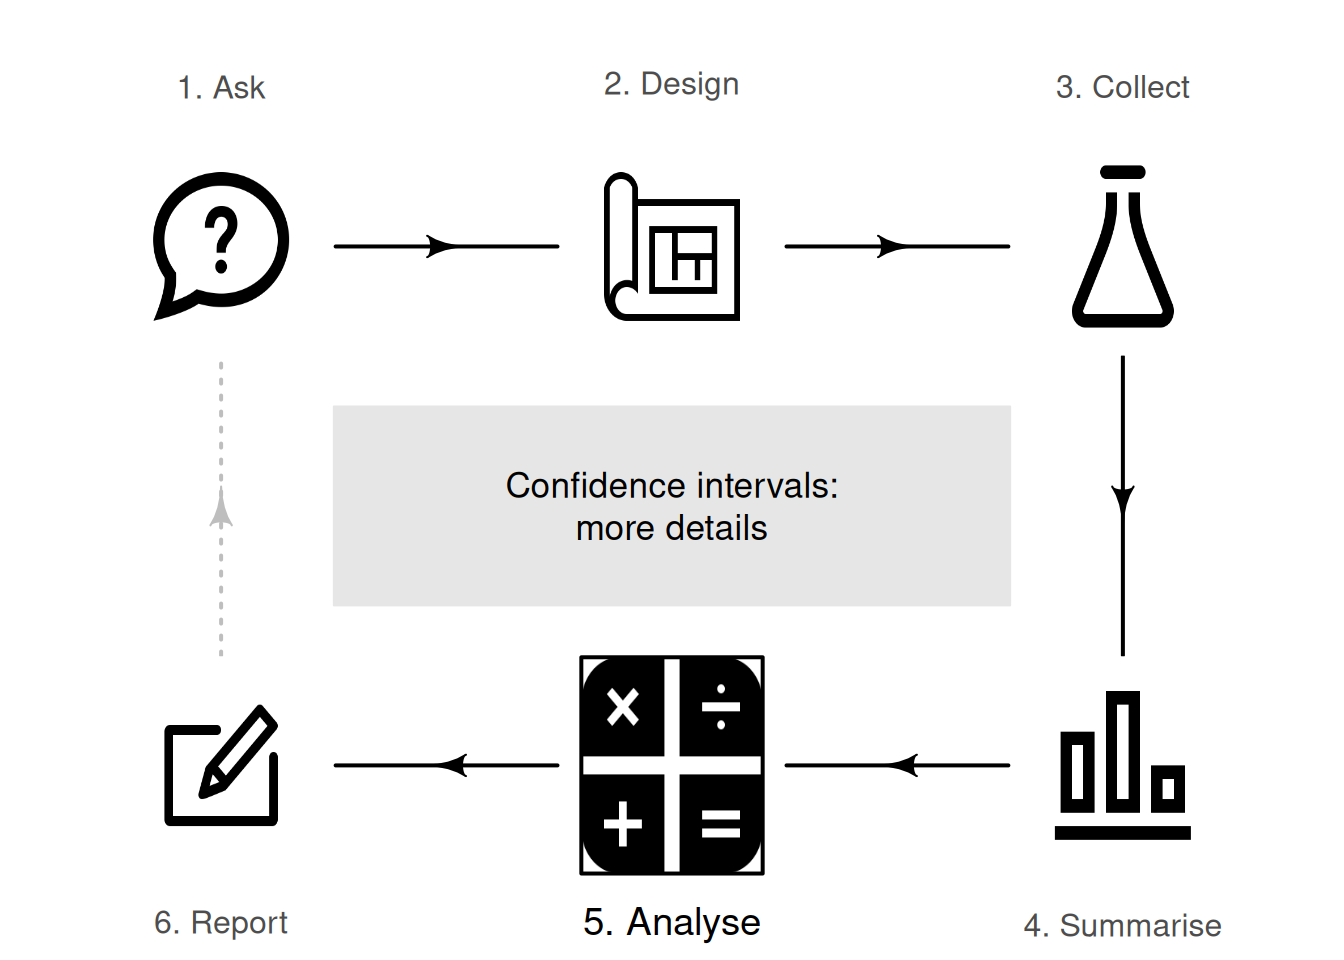
So far, you have learnt to ask an RQ, design a study, classify and summarise the data, and construct some confidence intervals. In this chapter, you will learn more about forming confidence intervals. You will learn to
- communicate confidence intervals.
- interpret confidence intervals.
24.1 General comments
The previous chapters discussed forming confidence intervals (CIs) for estimating a population proportion, and for estimating a population mean. CIs will also be studied (Chaps. 29 to 31) in other contexts. This chapter discusses some principles that apply to CIs in general:
CIs are formed for an unknown value of a population parameter (such as the population proportion \(p\)), using the best estimate: the value of the sample statistic (such as the sample proportion \(\hat{p}\)). When the sampling distribution of the statistic has an approximate normal distribution (and not all sampling distribution do have a normal distribution), CIs have the form \[ \text{statistic} \pm (\text{multiplier} \times \text{standard error}), \] where \((\text{multiplier} \times \text{standard error})\) is called the margin of error.
When the sampling distribution has an approximate normal distribution, the approximate \(95\)% CI uses a multiplier of \(2\) (from the \(68\)--\(95\)--\(99.7\) rule). To compute CIs other than \(95\)% CIs (such as \(99\)% CIs), and for exact \(95\)% CIs, software is used.
Confidence intervals (CIs) tell us about the unknown value of the population parameter, based on what we learn from one of the countless possible sample statistics.
24.2 More details about statistical validity
When CIs are computed, statistical validity conditions must be true to ensure the mathematics behind the calculations are sound. For instance, many CIs assume the sampling distribution has a normal distribution (so that, for example, the \(68\)--\(95\)--\(99.7\) rule can be used); the statistical validity conditions state the conditions under which the sampling distribution has an approximate normal distribution. If these conditions are not met, the sampling distribution may not be close to an approximate normal distribution, so the \(68\)--\(95\)--\(99.7\) rule (on which the CI is based) may not be appropriate, and the CI itself may be inappropriate. Of course, if the statistical validity conditions are close to being satisfied, then the resulting CI will still be reasonably useful.
Besides checking the statistical validity conditions, the internal validity and external validity of the study should be discussed (Fig. 24.1). In addition, CIs also require that the sample size is less than about \(10\)% of the population size; this is almost always the case.
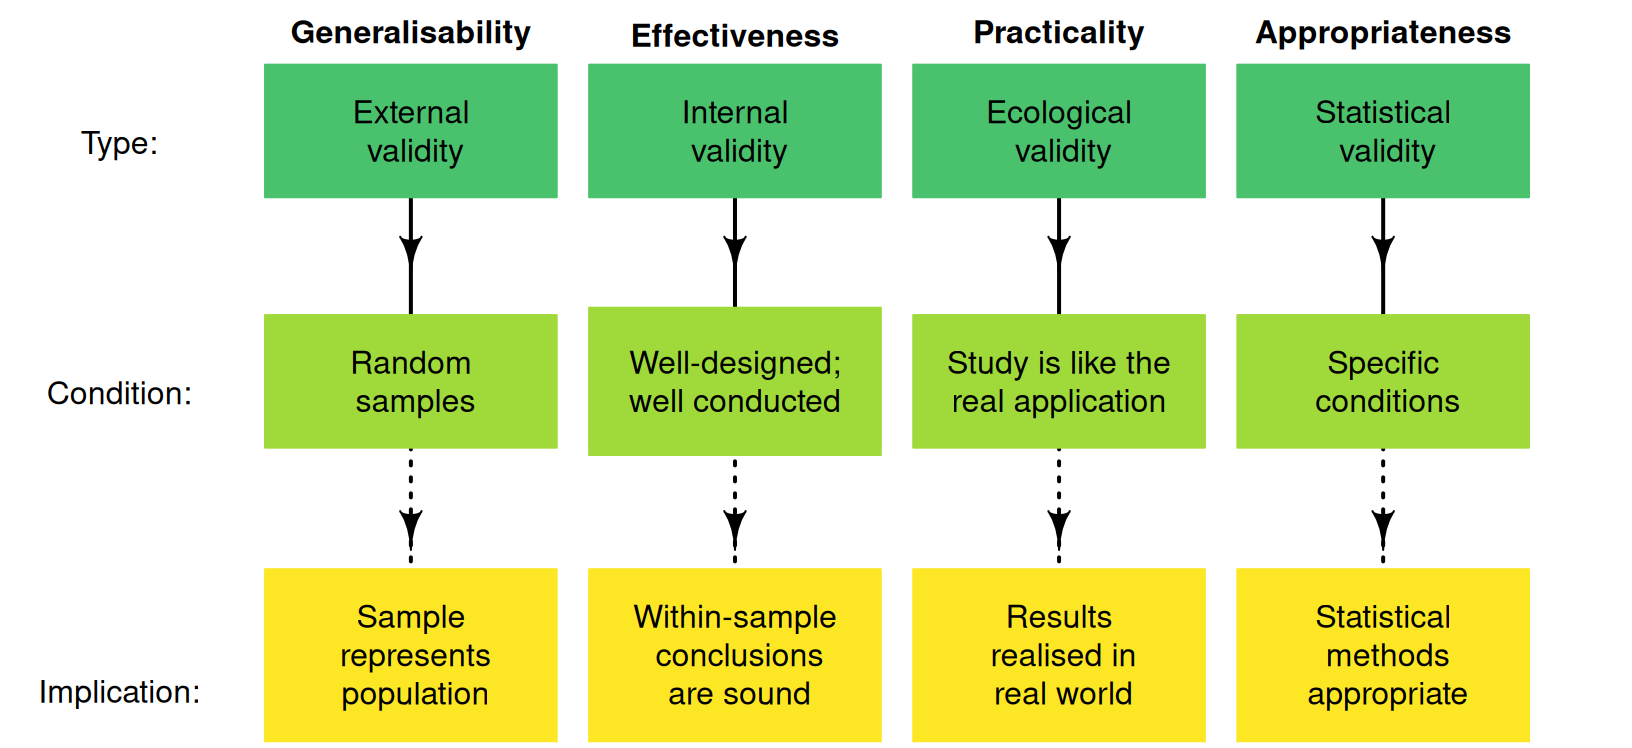
FIGURE 24.1: Four types of validities for studies.
24.3 More details about writing conclusions
When reporting a CI, include:
- the CI (including units of measurement, if relevant).
- the level of confidence for the CI (typically, a \(95\)% CI).
- the value of the statistic (the parameter estimate) and the sample size.
If the CI is an approximate CI (e.g., based on using an approximate multiplier of \(2\) from the \(68\)--\(95\)--\(99.7\) rule), this should also be clear.
Example 24.1 (Writing conclusions) In Sect. 23.6, the mean cadmium level of peanuts was estimated. The conclusion was:
The sample mean cadmium concentration of peanuts is \(0.0768\,\text{ppm}\) (\(n = 290\)), with an approximate \(95\)% CI from \(0.0714\) to \(0.0822\,\text{ppm}\).
Each of the three elements above are given.
- The CI: \(0.0714\) to \(0.0822\,\text{ppm}\).
- The level of confidence for the CI: \(95\)%.
- The value of the statistic: \(\bar{x} = 0.0768\,\text{ppm}\).
In addition, the CI is flagged as an approximate \(95\)% CI.
24.4 More details about interpreting CIs
Interpreting CIs correctly takes care. The correct interpretation (Def. 22.4) of a \(95\)% CI is:
The CI is an interval which contains the unknown value of the parameter \(95\)% of the time (over repeated sampling).
That is, if we repeated the process (of selecting a sample of a given size, then computing the CI) numerous times, \(95\)% of those CIs formed would contain the value of the parameter. This is the idea shown in the animation in Sect. 22.5.
In practice, this definition is unsatisfying, since we only ever have one sample, not many samples. Furthermore, since the value of the parameter is unknown (after all, the reason for taking a sample was to estimate the value of the parameter), we don't know if the CI from our single sample straddles the population parameter or not.
Two reasonable alternative interpretations for a \(95\)% CI are below.
- The \(95\)% CI gives a range of values of the parameter that could reasonably (with \(95\)% confidence) have produced the observed value of the statistic.
- There is a \(95\)% chance that the \(95\)% CI straddles the unknown value of the parameter.
These alternatives are adequate and common interpretations.
Frequently, the CI is described as having a \(95\)% chance of containing the population parameter. This is not strictly correct (the CI either does or does not contain the value of the population parameter), but is a common and a brief paraphrase for the correct interpretation above.
I use this analogy: most people say the sun rises in the east. This is incorrect; the sun doesn't rise at all. People say the sun rises in the east as a convenient way to explain that we see the sun each morning in the east as the earth rotates. Similarly, most people say a CI is an interval with a certain chance of containing the value of the population parameter, as a convenient way to explain the CI.
Example 24.2 (Interpreting CIs) In Example 24.1, the approximate \(95\)% CI for the cadmium concentration in peanuts was from \(0.0714\) to \(0.0822\,\text{ppm}\). The correct interpretation is:
If many samples of \(290\) peanuts were taken, and the approximate \(95\)% CI computed for each one, about \(95\)% of those CIs would contain the population mean.
Our CI may or may not include the value of \(\mu\), however. We might say:
This \(95\)% CI (from \(0.0714\) to \(0.0822\,\text{ppm}\)) has a \(95\)% chance of straddling the actual value of \(\mu\).
Alternatively, we could say:
The range of values of \(\mu\) that could plausibly (with \(95\)% confidence) have produced \(\bar{x} = 0.0768\) is between \(0.0714\) to \(0.0822\,\text{ppm}\).
In practice, the CI is usually interpreted as:
There is a \(95\)% chance that the population mean level of cadmium in peanuts is between \(0.0714\) to \(0.0822\,\text{ppm}\).
This last statement is not strictly correct, but is commonly-used, and sufficient for our use.
24.5 Chapter summary
Confidence intervals (or CIs) tell us about the unknown population parameter, based on what we learn from one the countless possible sample statistics. CIs give an interval in which a parameter is likely to lie over repeated sampling. Since we only ever have one sample, two reasonable alternative interpretations for a \(95\)% CI are:
- the \(95\)% CI gives a range of values of the parameter that could reasonably (with \(95\)% confidence) have produced our observed value of the statistic.
- there is a \(95\)% chance that our \(95\)% CI straddles the value of the parameter.
We never know if the CI from our single sample includes the population parameter or not. When reporting a CI, include:
- the CI (including units of measurement, if relevant);
- the level of confidence for the CI (typically, a \(95\)% CI); and
- the value of the statistic (the parameter estimate) and the sample size.
24.6 Quick review exercises
Are the following statements true or false?
- CIs always have \(95\)% confidence.
- Statistical validity concerns the generalisability of the results.
- CIs always include the value of the population parameter.
- All else being equal, a \(95\)% CI is wider than a \(90\)% CI.
- The 'multiplier times the standard error' is called the margin of error.
- We are fairly sure (but not certain) that the CI includes the value of the statistic.
24.7 Exercises
Answers to odd-numbered exercises are given at the end of the book.
Exercise 24.1 Hirst and Stedman (1962) computed a \(95\)% CI to estimate the proportion of trees with apple scab, and found \(\hat{p} = 0.314\) and \(\text{s.e.}(\hat{p}) = 0.091\). What would be wrong with the following conclusions?
- An approximate \(95\)% CI for the sample proportion is between \(0.223\) and \(0.405\).
- This CI means we are \(95\)% confident that between \(22.3\) and \(40.5\) trees are infected with apple scab.
Exercise 24.2 Fayet-Moore et al. (2017) studied the snacking habits of Australian children. In 2007 (for which \(n = 3\,637\)), the CI for the proportion of children snacking ('an eating occasion that occurred between meals based on time of day'; p. 1) was \(0.981\pm 0.003\) in 2007. What would be wrong with the following conclusion?
- An approximate \(95\)% CI for the sample proportion of snacks (in 2007) is \(0.981\pm 0.003\).
Exercise 24.3 Guirao et al. (2017) studied how far amputees could walk in two minutes following a femoral (leg) implant. After \(14\) months, the sample of ten amputees walked a mean of \(122.5\,\text{m}\); the \(95\)% CI was computed as \(96.4\,\text{m}\) to \(148.6\,\text{m}\). What would be wrong with the following conclusions?
- Approximately \(95\)% of the amputees walked between \(96.4\) and \(1\,488.6\,\text{m}\) in two minutes.
- The \(95\)% CI for the sample mean distance walked in two minutes was between \(96.4\) and \(1\,488.6\,\text{m}\).
Exercise 24.4 A study of sodium intake in Thailand found the \(95\)% CI for the mean daily sodium intake for subjects with a secondary school education was \(3\,565\) to \(3\,903\,\text{mg}\). What would be wrong with the following conclusions?
- This CI means that approximately \(95\)% of the subjects had a daily sodium intake between \(3\,565\) to \(3\,903\,\text{mg}\).
- A \(95\)% CI for the sample mean daily sodium intake is between \(3\,565\) to \(3\,903\,\text{mg}\).
Exercise 24.5 In discussing the weight of adult male Leadbeater's possums, J. L. Williams et al. (2022) state (p. 170):
The average adult male Leadbeater’s possum weighed \(137\,\text{g}\) (\(95\)% CI = \(135\,\text{g}\), \(139\,\text{g}\)), with \(90\)% of weights between \(122\) and \(153\,\text{g}\).
Figure 22.5 indicates that a higher value for the confidence level means wider CIs, since wider intervals are needed to be more certain that the interval contains the value of the parameter that produced the value of the statistic.
In light of this, explain why the \(90\)% interval is wider than the \(95\)% interval in the above quote.