Chapter 4 Understanding and Comparing Distributions
4.1 Displays for Comparing Groups
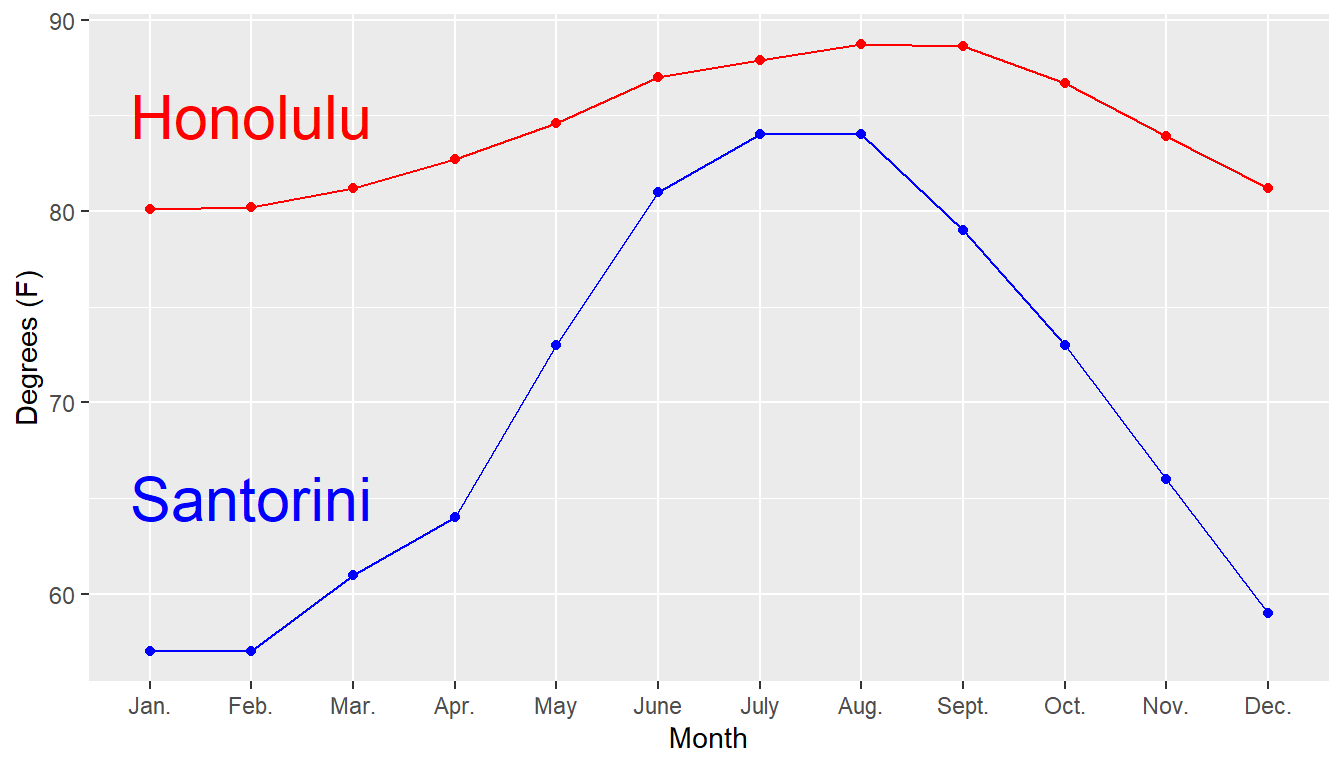
Let’s compare two popular tourist locations, in terms of temperature rather than rainfall. Santorini, Greece has the reputation of being warm in the summer (but cool in the winter, when there is little tourism), while Honolulu is noted for consistently warm temperatures throughout the year.
https://en.wikipedia.org/wiki/Santorini
https://en.wikipedia.org/wiki/Honolulu
Average High Temperatures (degrees Fahrenheit)
| Month | Santorini | Honolulu |
|---|---|---|
| January | 57 | 80.1 |
| February | 57 | 80.2 |
| March | 61 | 81.2 |
| April | 64 | 82.7 |
| May | 73 | 84.6 |
| June | 81 | 87.0 |
| July | 84 | 87.9 |
| August | 84 | 88.7 |
| September | 79 | 88.6 |
| October | 73 | 86.7 |
| November | 66 | 83.9 |
| December | 59 | 81.2 |
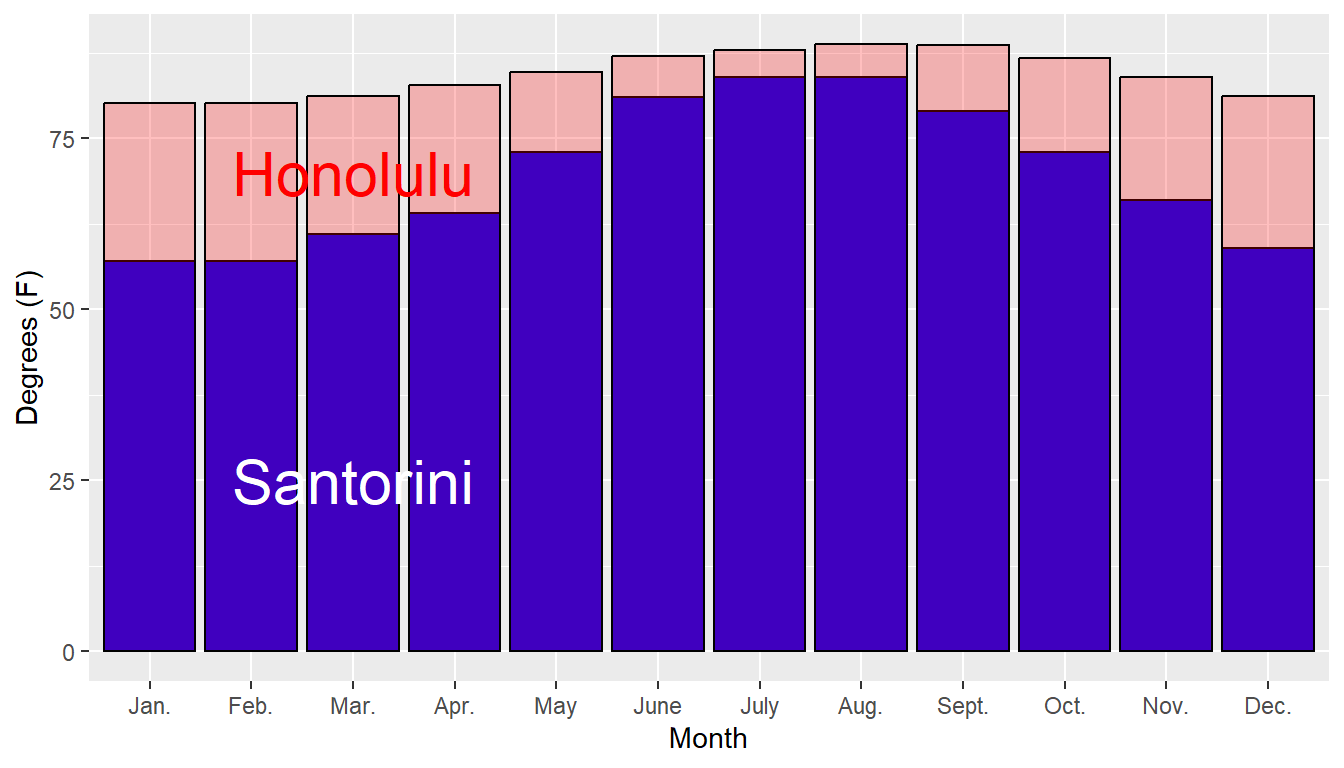
Here’s a time series plot of the data. Other graphical approaches could include bar charts or boxplots. Be careful with the scales of the axes!
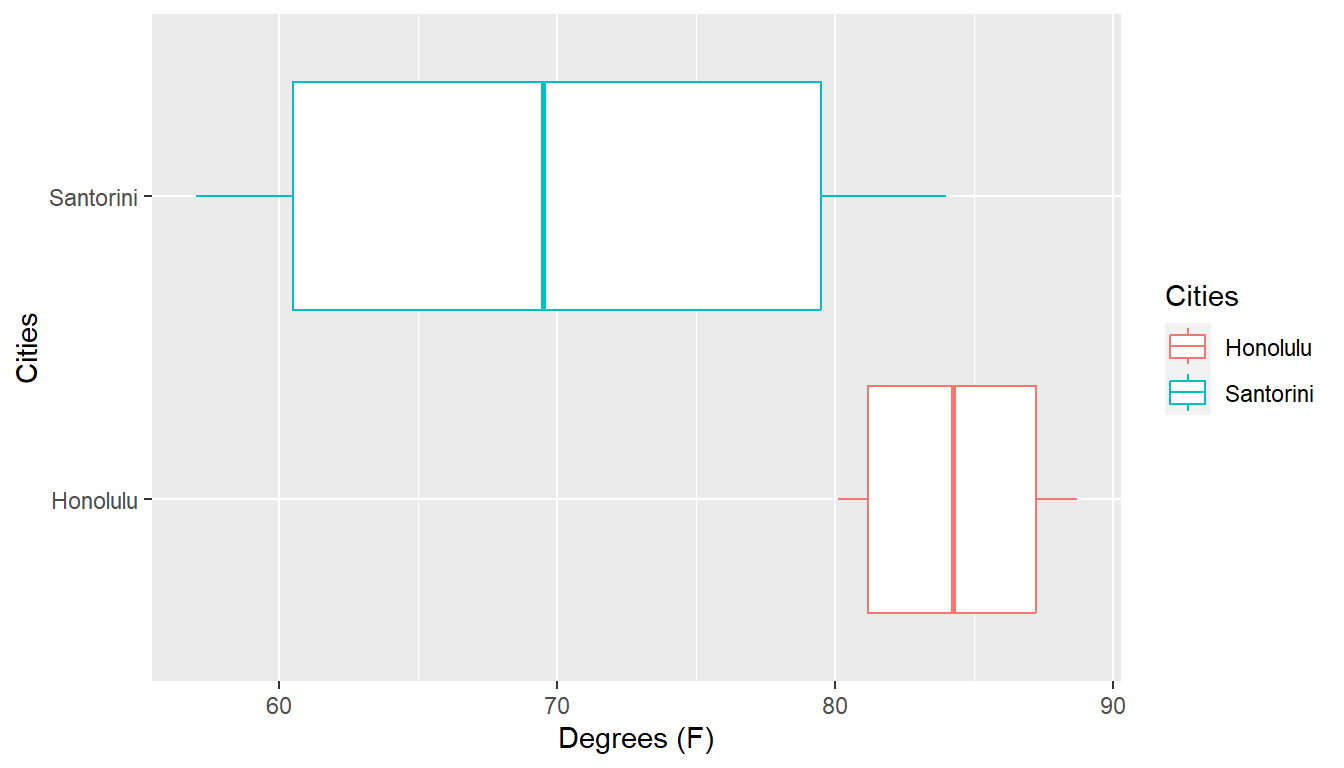
##      Cities  min   Q1 median    Q3  max     mean        sd  n missing
## 1  Honolulu 80.1 81.2  84.25 87.45 88.7 84.40000  3.305918 12       0
## 2 Santorini 57.0 60.0  69.50 80.00 84.0 69.83333 10.460604 12       0
A meaningful stemplot for Honolulu would probably use the tenths place, rather than the ones place, as the leaf. 80.1 would appear as \(80 | 1\) rather than \(8 | 0\). The \(80\) row would be for all temperatures from 80.0 to 80.9 degrees Fahrenheit.
4.2 Add/Subtract a constant
Let’s take a small sample of size \(n=5\) that are the ages of people.
\[36 \: \: 34 \: \: 31 \: \: 30 \: \: 22\]
Suppose I have computed the sample mean and standard devitation and got \[\bar{X} = \frac{\sum X}{n} = \frac{153}{5} = 30.6\]
So the standard deviation is:
| \(X\) | \((X-\bar{X})\) | \((X-\bar{X})^2\) |
|---|---|---|
| 36 | 5.4 | 29.16 |
| 34 | 3.4 | 11.56 |
| 31 | 0.4 | 0.16 |
| 30 | -0.6 | 0.36 |
| 22 | -8.6 | 73.96 |
Thus \[s^2 = \frac{\sum(X-\bar{X})^2}{n-1} = \frac{115.2}{4}=28.8\] \[s = \sqrt{s^2}= \sqrt{28.8} = 5.37\]
Now let’s look at these people 10 years from today. Obviously they will all be 10 years older. Mathematically, if \(X\) is your age today, we will let \(Y=X+10\). What do you think \(\bar{y}\) will be? How about \(s_Y\)?
4.3 Multiply/Divide by a constant
Let \(X\) represent the amount of money a person has in their wallet right now, measured in U.S. dollars. The exhange rate to Mexican pesos is that $1 US is approximatley $20 Mexican pesos (Mexico also uses the dollar sign for their currency). Go to https://www.xe.com/ for more precise and up-to-date conversions.
Amount for \(n=5\) people, in U.S. dollars
\[ 20 \: \: 42 \: \: 8 \: \: 65 \: \: 15\]
For this small sample \(\bar{X}=30\) and \(s_X=23.3345\).
Let \(Y=20X\) be the amount of Mexican pesos you get. For example, the first person with a $20 bill gets \(Y=20 \times 5=100\) pesos.
What do you think \(\bar{Y}\) will be? What about \(s_Y\)?
It was probably not to hard to guess (and be correct in your guess) that \(\bar{Y}=20\bar{X}=20 \times 30 = 600\). Let’s see what \(s_Y\) will be.
| \(X\) | \(Y\) | \((Y-\bar{Y})\) | \((Y-\bar{Y})^2\) |
|---|---|---|---|
| 20 | 400 | -200 | 40000 |
| 42 | 840 | 240 | 57600 |
| 8 | 160 | -440 | 193600 |
| 65 | 1300 | 700 | 490000 |
| 15 | 300 | -300 | 90000 |
Thus \[s^2_Y = \frac{\sum(Y-\bar{Y})^2}{n-1} = \frac{871200}{4}=217800\] \[s_Y = \sqrt{s^2_Y}= \sqrt{217800} = 466.69\]
Notice that \(20 s_X = 20 \times 23.3345 = 466.69\)$ Both the mean and standard deviation of our money was multiplied by 20.
4.4 Linear Transformation
Let’s get crazy and do both add a constant and multiply a constant at the same time. For example, we can convert degrees Celsius to degress Fahrenheit with the formula \[F = 1.8 C + 32\]
Here’s the predicted low temperature in 6 world cities on January 22, in degrees Celsius.
| City | Temperature |
|---|---|
| Toronto, Canada | -4 |
| Seoul, South Korea | 0 |
| Amsterdam, Netherlands | 5 |
| Lagos, Nigeria | 26 |
| Murray, Kentucky | 1 |
| Melbourne, Australia | 13 |
The mean and standard deviation of this sample of size \(n=6\) is \(\bar{C}=41/6=6.83\) and \(s_C=11.02\) degrees Celsius.
If you are American, you want this in degrees Fahrenheit, so let’s convert.
| City | Temperature |
|---|---|
| Toronto, Canada | 1.8(-4)+32=24.8 |
| Seoul, South Korea | 1.8(0)+32=32 |
| Amsterdam, Netherlands | 1.8(5)+32=41 |
| Lagos, Nigeria | 1.8(26)+32=78.8 |
| Murray, Kentucky | 1.8(1)+32=33.8 |
| Melbourne, Australia | 1.8(13)+32=55.4 |
What will the mean be in degrees Fahrenheit? The mean is changed both by the multiplication of a constant (there are 1.8 Celsius degrees per Fahrenheit degree) and the addition of a constant (we add 32 to account for the fact that water freezes at 0 C and 32 F). So the mean in terms of degrees F will be: \[\bar{F} = 1.8 \bar{C} + 32 = 1.8(41/6)+32=44.3\]
However, the standard deviation is ONLY affected by multiplication/division of a constant and NOT by addition/subtraction. So \[s_F = 1.8 s_C = 1.8(11.02) = 19.84\]
In general, when we do the linear transformation \[Y = cX + d\] then the mean will be \[\bar{Y}=c\bar{X}+d\] and the standard deviation will be \[s_Y = c s_X\]
For Celsius (\(X\)) to Fahrenheit (\(Y\)), the constants \(c\) and \(d\) were \(c=1.8\) and \(d=32\)