Chapter 10 Sampling Methods & Surveys
These notes supplement Chapter 10 of our textbook.
10.1 Sampling From a Population
https://news.gallup.com/poll/262166/americans-converse-family-matters-politics.aspx
This article “Americans Converse More About Family Matters Than Politics” discusses the results of a recent poll conducted on people’s behaviors involving their conversations with family and friends.
A population includes all individuals or objects of interest. A census is the collection of data from an entire population. It is usually not possible to conduct a census.
A sample is a subset of a population that we collect data from. We hope to be able to make generalizations about the population based on the sample. If the sample is collected properly, methods of statistical inference can help us with such conclusions. For example, we could determine if a drug is effective in lowering cholesterol or what percent of the population will vote for a political candidate.
A parameter is a numerical characteristic of a population. It is usually not known, so we estimate it by collecting a sample and calcuating a statistic.
It is customary (although there are exceptions) to use Greek letters to describe population parameters and Roman letters for sample statistics. The most common example is the mean (average). The population mean is denoted as \(\mu\). Since we typically do not have access to the entire population, we collect data from a sample and estimate the unknown parameter \(\mu\) with a reasonable statistic, such as the sample mean \(\bar{x}\) or “x-bar”, which is just the arithmetic average of the numbers.
Another parameter of interest is the proportion of a population, denoted in some books as \(\pi\) but in other books, such as ours, with \(p\). The sample proportion is \(\hat{p}\) or “p-hat”, which is just the proportion.
A sample is a portion or subset of a larger population, where the population is the collection of all people/objects/things we would want to make a conclusions about. If I wanted to know what proportion of the population discuss politics with their family and since it is impossible to survey all Americans, we use a smaller portion (often around 1000) Americans as a sample to base any conclusions or inferences that we draw.
Numerical characteristics of samples are called statistics and we generally use Latin letters to represent them. For example, the article says that only 24% of Americans had discussed politics with family/friends in the last week. This is based on a sample and we say \[\hat{p}=0.24\]
If we knew the proportion for an entire population, we often (but not always) will use a Greek letter. From the article https://thriftytraveler.com/us-citizens-passport/, 42% of Americans have a passport. Since the total number of passport holders and the total American population are (more or less) known, it is a population parameter rather than a sample statistics, we say \[\pi=0.42\] or often \[p=0.42\] (we often don’t use the Greek letter here since \(\pi\) has a special meaning as a mathematical constant).
Another common instance of sample statisics and population parameters are with the mean (average). If I ask a sample of \(n=100\) college students how many texts they sent yesterday, the sample mean could be \[\bar{x}=17.2\] If I compute a mean (or average) for an entire populatons, we would use the Greek letter \(\mu\). For instance, the mean salary of a major league baseball players (a small, known population) is \[\mu=4.3\] or $4.3 million dollars! Source:
https://www.statista.com/statistics/236213/mean-salaray-of-players-in-majpr-league-baseball/
10.2 Statistical Significance
At this stage of the course, we will define being statistically significant as when the difference observed between groups is larger than would be expected to occur by chance if there was no difference in the groups.
Later this semester, we will look a bit deeper into the mathematics involved in determining when something is significant. The sample size and desired level of confidence are both important factors in this determination.
Women are significantly more likely than men to say they talk about family and personal matters, by 53% to 38%. Notice there is a 15% difference between the genders on this aspect, and this is deemed large enough to have not happened by chance.
Men are slightly more likely than women to talk about politics or their job, but the differences are not statistically meaningful. Notice in the table that the difference in talking about politics was 28% male and 20% female, and for the job it was 21% to 13%. However, with our sample size and the 95% level of confidence, this difference is not large enough to be deemed significant.
This concept of statistical significance is vital in planned experiments. For example, if we are testing a new drug that is supposed to cure a disease versus a placebo, the drug will not be approved unless it is significantly better (in the statistical sense) than the placebo.
Statistical significance can be assessed with either confidence intervals/margin-or-error or a hypothesis test/p-values. We’ll discuss both later this semester. Traditionally, \(p\)-values were emphasized, but the American Statistical Association and several important academic journals like the New England Journal of Medicine have recommended more emphasis be placed on confidence intervals and margins-of-error.
10.3 Why Collect a Sample?
Typically in a research setting, it is necessary to collect data. It is crucial to use proper methodology for data collection, or the effort can be in vain.
Data will often be collected with surveys or with an experiment. We will look at a couple of typical scenarios before starting a formal study of the methodology and terminology.
Collecting a Sample of Teachers or a Sample of Voters
Question: In the state of Kentucky, there are about \(N=40000\) public school teachers at the K-12 level. Suppose it is necessary to collect a sample of \(n=400\) of those teachers. Explain how you would go about collecting such a sample. Discuss what sort of real-life logistical problems you might encounter in attempting to collect data from this sample.
Question: You are trying to estimate what percent of voters thought that Hillary Clinton or Donald Trump won the first presidential debate. How would you go about collecting such a sample? Again, discuss what sort of real-life logistical problems you might encounter in attempting to collect data from this sample.
10.4 Population
Let us reconsider the scenario where we were ‘brainstorming’ on how to collect a sample of size \(n=400\) from a population of \(N=40000\) public school teachers.
Here, we have defined our target population as consisting of all individuals that are employed as K-12 public school teachers in the state of Kentucky. This is a large population, and it is unlikely that we would be able to conduct a census and collect data on the entire population. This is why we take a subset of the population, or sample, and compute a statistic to estimate a parameter of interest. For example, maybe we want to know what percentage of public school teachers are aware of Senate Bill 1.
If my target population was even larger, such as a national poll conducted by the Gallup Organization or other company, to see what percentage of the public approves of the President’s job performance, conducting a census is impossible. These companies generally rely on a sample of several hundred to a few thousand registered voters to make a conclusion about the value of this parameter for the nation in general.
It may seem amazing to you, but a relatively small sample, if collected using the methods of probability sampling, can accurately estimate these parameters when a much larger sample collected in a sloppy fashion can be biased and therefore completely worthless.
An excellent article in Scientific American explains how a relatively small sample can be highly accurate, while a larger sample can be worthless.
http://www.scientificamerican.com/article/howcan-a-poll-of-only-100/
10.5 Non-Probability Sampling
If a sample is collected in a non-random or nonscientific manner, then we do not know the probability of a member of the population being selected. The data will be biased and may overrepresent some segments of the population and underrepresent others.
A famous historical example was the Literary Digest poll in 1936. This magazine, popular at the time, was trying to determine if President Franklin D. Roosevelt (Democrat) would win re-election, or if he would be defeated by Republican Alf Landon. They included a stamped addressed postcard in each issue of the magazine and had readers mail them in. Several hundred thousand postcards were returned. In addition, many thousands of people were contacted by telephone.
10.6 Non-Probability Sampling (continued)
When the results were compiled, about 60% of readers supported Alf Landon. Since you’ve probably never heard of Alf Landon (who was the governor of Kansas), you know that he did not win the election in 1936? Why did this sample give such an inaccurate result?
It turned out that the readership of Literary Digest was mostly fairly wealthy people, especially during the Great Depression. The survey was biased and overrepresented wealthy Americans, who were more likely to be Republicans, and underrepresented the working class and unemployed, who were more likely to be Democrats.
10.7 Selection Bias
It is also important to consider who responds and who fails to respond (non-response) in a survey. This was an issue in the Literary Digest survey, and the next few slides will show a 21st century example.
It is very common for websites to have surveys to ask the visitors some sort of question. For example, there is usually a poll asking some sort of sports-related question (i.e. who will win the Super Bowl?) at http://www.espn.go.com. These surveys are fun and are meant strictly for entertainment, but no serious conclusions should be drawn from them.
The following is a poll taken from http://drudgereport.com shortly after the first 2016 Presidential debate. This is a website is a politically conservative American news aggregation website.

This is a convenience sample, not a scientific sample, and does not have a margin of error.
The tweet below reports the results of a poll taken by CNN/ORC.
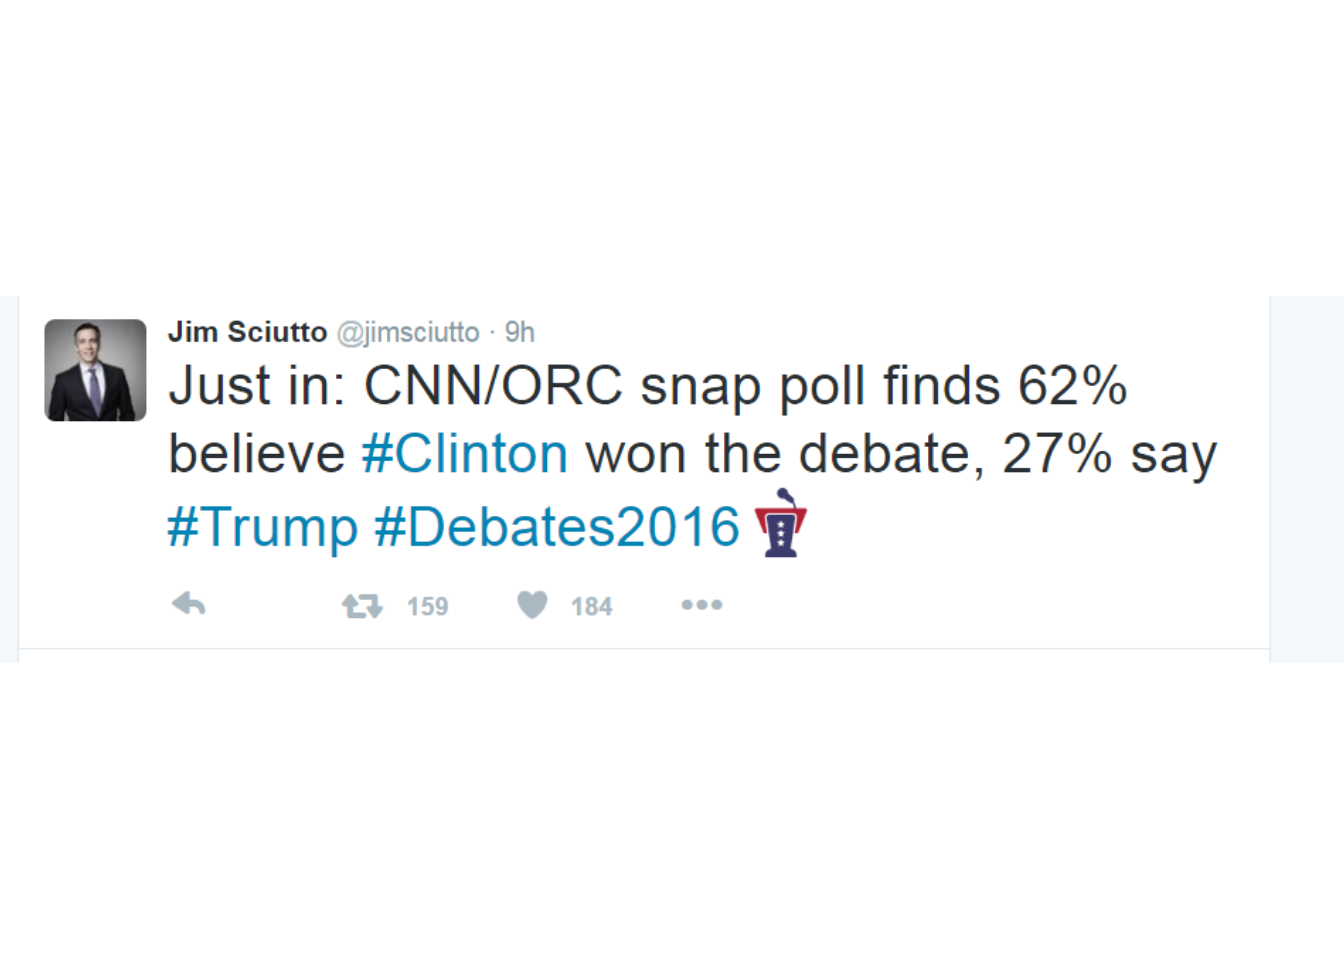
More complete results of that poll are here: http://i2.cdn.turner.com/cnn/2016/images/09/27/poll.pdf
It was a scientific sample, and does have a margin of error reported with it.
Many other polls by various newspapers, news channels, and other sites have widely varying estimates of who won the debate.
10.8 Sampling Mistakes
Sample volunteers (voluntary response bias)
Sample “Conveniently” (convenience sampling)
Use a poor sampling frame (maybe one that misses parts of the population)
Undercoverage (portions of the population are undersampled or not sampled at all)
Nonresponse bias (I won’t take your call or mail back your survey)
Response bias (leading questions; questions about illegal or embarassing or private activities one doesn’t want to admit)
10.9 Probability Sampling
How do we avoid selection bias and end up with a good scientific sample? By using a method based on probability sampling, where we know the chance that each member has a known chance of being included in the sample. There are four main methods of probability sampling, and you likely described some of them when answering the question about how you would take a sample from the population of teachers.
Simple Random Sampling
Systematic Sampling
Stratified Sampling
Cluster Sampling
10.10 Simple Random Sampling
To conduct a simple random sample, we need to have a sampling frame. A sampling frame is a list of all of the elements of a population; for instance, the names of all 40000 public school teachers.
Each individual is assigned an integer between 1 and \(N\). A total of \(n\) random integers between 1 and \(N\) are drawn, and those individuals make up the simple random sample. If one of the randomly drawn numbers was #33769, and that was Mr. B. Stein, a high school economics teacher, then he would be in the sample.
If we drew many such simple random samples, we would get somewhat different results–this is called sampling variability.
A major advantage of simple random sampling is that instead of allowing participants to select (or not select) themselves, such as in the Literary Digest or Drudge Report examples, impersonal chance determines who is chosen, removing selection bias.
One disadvantage is if a sampling frame is flawed or unavailable. For example, it might be difficult or impossible to compile an accurate list of all teachers in Kentucky. It might be easier to obtain a sampling frame listing all school districts. Another disadvantage is that it can be cumbersome to draw many random numbers, but computer software is typically used to draw random samples.
10.11 Systematic Sampling
Instead of drawing a simple random sample, we can draw a 1-in-\(k\) sample, usually called a systematic sample. We compute \(k=\frac{N}{n}\), choose a random integer between 1 and \(k\), and use that individual and every \(k^{th}\) individual after as the sample.
For the teachers problem, \(k=\frac{40000}{400}=100\). Choose a random number between 1 and 100. Suppose it is 37; we will sample the 37th teacher, 137th teacher, 237th teacher, and so on.
This can be very convenient in an industrial setting. We might choose to sample every \(200^{th}\) computer off the assembly line to check for quality control purposes.
Although systematic sampling is convenient to use, it can be flawed if there is a cyclical pattern in the sampling frame. For example, suppose a systematic sample ended up sampling the number of absent students or patients admitted to a hospital in such a way that the entire sample was from the same day of the week (say Friday). I think you can see the potential for inadvertent bias.
10.12 Stratified Sampling
Sometimes it makes sense to divide the population into homogeneous groups, which are called strata (the singular is stratum), before the stratified random sample is selected.
For example, in the teachers example, I might divide the population into three groups: elementary teachers (K-5), middle school teachers (6-8), and high school teachers (9-12). Suppose that 50% of the population are elementary teachers, 20% middle school, and 30% high school.
Then three separate simple random samples would be collected. With the desired total sample size of \(n=400\), we would select \(n_1=200\) elmentary, \(n_2=80\) middle school, and \(n_3\)=120 high school teachers.
Other categorical variables, such as sex, race, age group, etc. can be used as the stratification variable.
As you can see, collecting a stratified sample as opposed to a simple random sample is a bit more involved. Why do we bother going through the extra trouble, especially since both samples are random?
A big advantage of stratified sampling is that it can reduce the total variability of the sample statistics. In a political poll or opinion survey, this means that we could either have a smaller margin of error (desirable), or we can use a smaller total sample size to obtain a particular margin of error (also desirable).
In addition, we would often be interested in reporting the statistics by strata: for example, if there are differences in opinion between elementary/middle school/high school teachers, between men and women, between different racial groups, etc.
10.13 Cluster Sampling
Another sampling techique, which is often confused with stratified sampling, is cluster sampling.
In this method, the population is divided into representative subgroups, which are heterogenous rather than homogenous. This subgroups are called clusters. Then, instead of taking a simple random sample of individuals in the population, a simple random sample of the clusters is taken. In the purest form of cluster sampling, everyone in the chosen clusters is used, although in practice it is common to take a simple random sample or stratified sample of the chosen clusters.
In the teachers example, it might be difficult or impossible to get a sampling frame listing all teachers in the state. A frame of all school districts in Kentucky would be easier to obtain. We could randomly select a certain number of school districts and use the teachers at those districts.
Students often confuse stratified and cluster sampling. They appear similar because both methods involve dividing the population into subgroups.
In stratified sampling, the idea is to divide into strata where everyone within a stratum are similar on a characteristic of interest (i.e. teach the same grade level, same sex, same race, etc.) Often this is done to make sure the sample `fairly’ represents the population.
In cluster sampling, the idea is to divide into clusters where ideally the individual clusters are microcosms of the population. Then, we can reduce the time and money needed to collect the sample by sampling clusters rather than individuals.
10.14 Multistage Sampling
Most companies (Gallup, Rasmussen, news organizations, etc.) that take large surveys regularly combine several of these techniques into what is called a multistage sample.
First, cluster sampling might be used to randomly select certain geographic areas; it is common to use census tracts or neighborhood blocks, which are subdivisions used by the U.S. Census Bureau. Then the company or researcher might choose to use stratified sampling within the chosen census tracts on a stratification variable(s) of interest.
These sample designs can be quite complicated, but the intention is to try to gain the advantages of the various methods, especially when a simple random sample is not feasible.